The uncertainty of science: The largest ozone hole ever detected over the north pole has now closed.
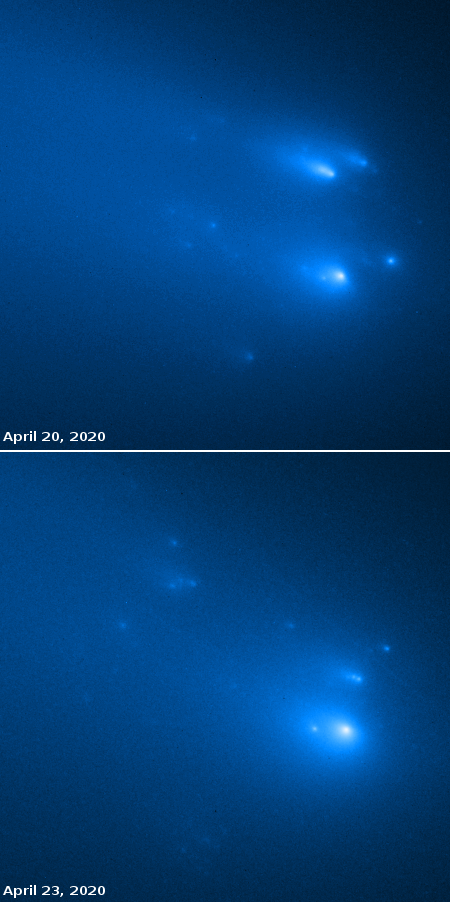
After looming above the Arctic for nearly a month, the single largest ozone hole ever detected over the North Pole has finally closed, researchers from the European Union’s Copernicus Atmosphere Monitoring Service (CAMS) reported. “The unprecedented 2020 Northern Hemisphere ozone hole has come to an end,” CAMS researchers tweeted on April 23.
The hole in the ozone layer — a portion of Earth’s atmosphere that shields the planet from ultraviolet radiation — first opened over the Arctic in late March when unusual wind conditions trapped frigid air over the North Pole for several weeks in a row. Those winds, known as a polar vortex, created a circular cage of cold air that led to the formation of high-altitude clouds in the region. The clouds mixed with man-made pollutants like chlorine and bromine, eating away at the surrounding ozone gas until a massive hole roughly three times the size of Greenland opened in the atmosphere, according to a statement from the European Space Agency (ESA). [emphasis mine]
Note that the north pole hole occurred because of unusually frigid and cold conditions, something I thought we were never going to see again because of global warming.
The last paragraph of the article at the link reveals a lot of ignorance by its writer, Brandon Specktor, where he discusses the south pole ozone hole. First, he says it “has existed for roughly four decades.” Wrong. The south pole ozone hole was first detected in the 1950s, and has likely existed every winter for eons.
Next, he wonders if it is “starting to close.” Wrong. That ozone hole opens every winter and closes every summer, like clockwork. When winter arrives and the south pole is in darkness, oxygen molecules are no longer being ionized by sunlight and thus there is a drop in the production of ozone, producing the hole. When sunlight begins hitting the upper atmosphere in the spring it starts ionizing oxygen molecules again to produce ozone, and the hole goes away.
Then he notes that scientists hope the hole will “heal” and forever disappear by 2050. Wrong. The data says instead that the south pole ozone hole is a natural phenomenon that occurs every winter. It is not a wound against the earth.
Finally, he claims that the south pole ozone hole exists almost entirely because of us evil humans, first because of global warming and second because until 1987 we put ozone-depleting pollutants into the atmosphere. Wrong. As I said, the ozone hole is almost entirely a natural phenomenon, caused each winter because sunlight is no longer hitting the upper atmosphere above Antarctica and thus oxygen molecules are no longer being ionized into ozone. Those pollutants might have made it slightly larger in the late 20th century, but then, that theory has a problem, as most of those pollutants were released in the northern hemisphere, where they would have little or no interaction with the atmosphere of the southern hemisphere. (The atmospheres of the two hemispheres are largely independent.) Yet it was only in the south that we have generally seen an ozone hole
I predict, very confidently, that come 2050 climate scientists will discover, “unexpectedly”, that the south pole ozone hole has not “closed” or “healed”, but continues to reappear, each winter. And they will have by then discovered that depending on circumstances, a north pole ozone hole also appears during some colder winters, which despite their repeatedly failed predictions of global warming will likely continue to happen.


