Solar scientists come up with another “method” for predicting the Sun’s future sunspot activity
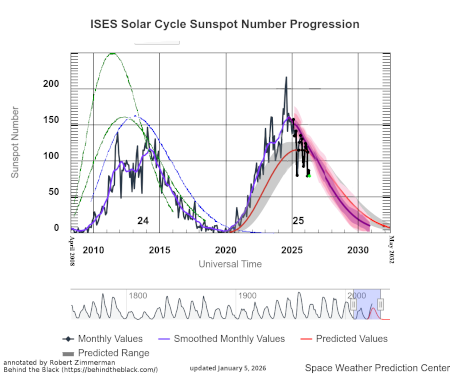
The uncertainty of science: Using archival data from the last four sunspot cycles, solar scientists think they have found a new method for predicting the Sun’s future sunspot activity, based on what they claim is a “switch-off” moment in each cycle when the most extreme solar events stop happening.
The new prediction method builds on Professor Chapman’s previously developed ‘sunclock’, which maps the Sun’s irregular cycles onto a standard clock. This revealed that the most extreme space weather does not gradually fade away but instead switches off at a distinct point in each solar cycle.
Professor Chapman’s team has found that the number of sunspots present at this switch-off point is closely linked to the peak number of sunspots in the following solar cycle. This provides a new forecasting method that can predict the strength of the next solar cycle around six to seven years before it reaches its maximum, giving a longer lead time than current methods, which rely on waiting until the solar minimum.
Sounds good, eh? I would not bet one plug nickel on this prediction method. It might work, or it might not, but even if it does, it is not based on any real understanding of why sunspots rise and fall every eleven years. Nor does it explain why the Sun’s magnetic field flips polarity in line with that sunspot cycle. This prediction is merely using past behavior to predict future actions, a method that every stock broker will tell you is fraught with danger.
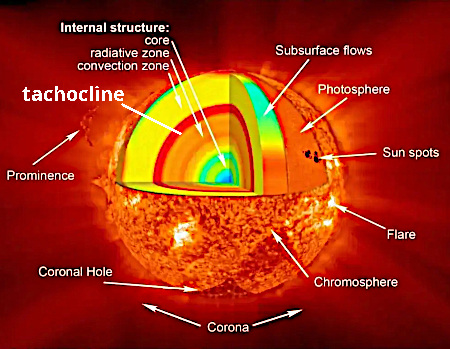
Knowing however that there is a moment in each cycle where the most active sunspots and solar flares stop happening is useful. This pattern could help theorists figure out what is really going on inside the Sun.