Engineers regain contact with Proba-3’s Coronagraph probe
The Proba-3 mission. Click for original.
A month after all contact was lost with the Coronagraph probe of Europe’s two-spacecraft Proba-3 solar observatory, engineers have regained contact with it this week, and have been able to place it in safe mode in preparation for re-establishing science operations.
After more than a month of silence, ESA’s ground station in Villafranca, Spain, received telemetry from the Coronagraph spacecraft. Telemetry is a package of data sent by a spacecraft including information on its temperature, voltages, and health of onboard systems.
The Coronagraph is now in safe mode and stable, and the mission team and operators are running health checks on the spacecraft to understand if any parts of it have been damaged.
The spacecraft’s solar panel is facing the Sun, powering the essential electronics on board, and charging the battery with the remaining power.
Before it can resume observations engineers need to get the spacecraft back up to operating temperature after a month without power.
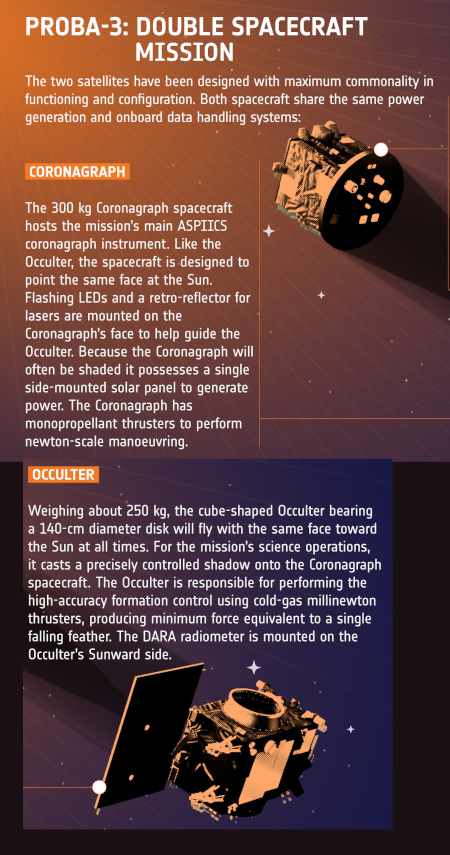
As shown in the graphic to the right, the Coronograph satellite is the heart of this mission. It records the data, available because the Occulter blocks the Sun from view so that the corona, the Sun’s atmosphere, can be seen. It is almost a miracle that it has survived that month, and can soon resume observations.
The Proba-3 mission. Click for original.
A month after all contact was lost with the Coronagraph probe of Europe’s two-spacecraft Proba-3 solar observatory, engineers have regained contact with it this week, and have been able to place it in safe mode in preparation for re-establishing science operations.
After more than a month of silence, ESA’s ground station in Villafranca, Spain, received telemetry from the Coronagraph spacecraft. Telemetry is a package of data sent by a spacecraft including information on its temperature, voltages, and health of onboard systems.
The Coronagraph is now in safe mode and stable, and the mission team and operators are running health checks on the spacecraft to understand if any parts of it have been damaged.
The spacecraft’s solar panel is facing the Sun, powering the essential electronics on board, and charging the battery with the remaining power.
Before it can resume observations engineers need to get the spacecraft back up to operating temperature after a month without power.
As shown in the graphic to the right, the Coronograph satellite is the heart of this mission. It records the data, available because the Occulter blocks the Sun from view so that the corona, the Sun’s atmosphere, can be seen. It is almost a miracle that it has survived that month, and can soon resume observations.