Sunspot update: in October solar activity increased after September’s crash

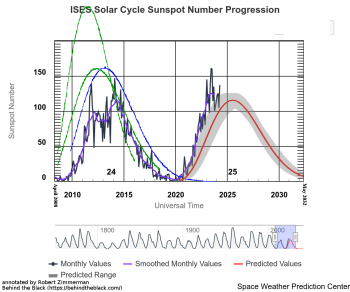
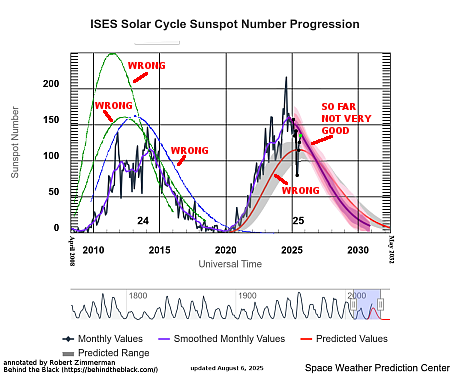
Time for this month’s sunspot update. As I have done every month since I started this website in 2010, I am posting NOAA’s most recent update of its monthly graph tracking the number of sunspots on the Sun’s Earth-facing hemisphere, adding some additional details to provide context.

In October, following a crash in activity in September, the Sun showed a slight increase the number of sunspots. The increase did not match the drop from the month before, but it brought the activity back up to the level seen during the summer.
» Read more

NOAA and NASA declare the Sun has reached solar maximum

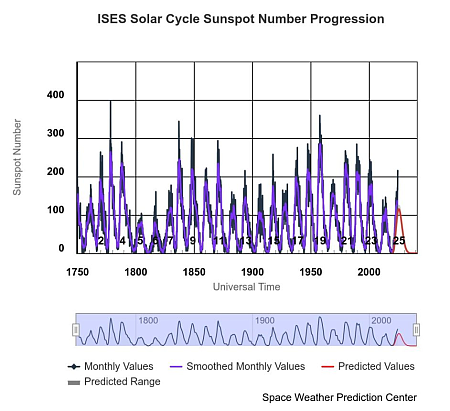
The sunspot cycle since the 1700s
Click for originial graph.

The uncertainty of science: During a press conference yesterday NOAA and NASA scientists announced that they now believe the Sun has reached solar maximum as part of its regular 11-year sunspot cycle.

“This announcement doesn’t mean that this is the peak of solar activity we’ll see this solar cycle,” said Elsayed Talaat, director of space weather operations at NOAA. “While the Sun has reached the solar maximum period, the month that solar activity peaks on the Sun will not be identified for months or years.”

Scientists will not be able to determine the exact peak of this solar maximum period for many months because it’s only identifiable after they’ve tracked a consistent decline in solar activity after that peak. However, scientists have identified that the last two years on the Sun have been part of this active phase of the solar cycle, due to the consistently high number of sunspots during this period. Scientists anticipate that the maximum phase will last another year or so before the Sun enters the declining phase, which leads back to solar minimum. Since 1989, the Solar Cycle Prediction Panel — an international panel of experts sponsored by NASA and NOAA — has worked together to make their prediction for the next solar cycle.

In other words, they have no idea yet it the actual peak has been reached. All they are really telling us is that the Sun is now in that maximum phase, something that has been very evident for many months.

This announcement is filled with a lot of blarney. For example, one scientist is quoted as saying the activity this maximum “has slightly exceeded expectations.” A simply glance at the graph they released, shown on the right, illustrates how wrong that statement is. The activity has been almost twice what was predicted (as indicated by the red curve). And though they say we have hit maximum, they admit they don’t know if we have reached the peak yet.

Having followed the predictions of the solar scientist community on this subject now for more than two decades, I have learned that this community knows far less than it lets on, and likes to exaggerate its capabilities to predict what the Sun will do. At the same time, they have also often played Chicken Little, warning everyone that if we don’t pay attention to them and do what they say, sun storms and solar activity will kill us all. (Interestingly, this announcement backs off somewhat from that doom-saying, making it a refreshing change.)

Sunspot update: Sunspot activity crashes in September

As it is the start of the month, it is time another monthly sunspot update, in which I provide some context and analysis to NOAA’s most recent update of its monthly graph tracking the number of sunspots on the Sun’s Earth-facing hemisphere.

After several months in which the number of sunspots rose considerably each month, in September the sunspot count crashed, dropping precipitously to levels closer to the various predictions of solar scientists, but still far above what they had all expected at this time of the solar maximum.

» Read more

Sunspot update: In July the Sun produced the most sunspots in almost a quarter century

Every month since this website began fourteen years ago, when NOAA posts its update of its monthly graph tracking the number of sunspots on the Sun’s Earth-facing hemisphere, I post my own analysis, adding some details to provide the larger context.

Of all those updates — numbering about 168 — this month’s is possibly the most significant. Since around 2008, the Sun began a long period where it was unusually quiet, with the solar maximum that occurred in 2014 possibly the weakest in two hundred years. Before that weak maximum begun, half the solar science community predicted it would be a very powerful maximum, while half predicted a weak maximum. Both got it wrong, though the weak prediction was closer though still too high.

When it came time to predict the next solar maximum, expected around 2025, that same solar science community was once again in disagreement. Most approved a NOAA science panel prediction in April 2020 calling for another weak minimum, similar to the one in 2014. A few dissented, however, and instead predicted in June 2020 that the maximum would be one of the strongest ever. In April 2023 however those dissenters chickened out, and revised their prediction downward, still forecasting a peak higher than the NOAA prediction but no longer anywhere as intense.

Based on what happened on the Sun in July, they should have had more faith in their earlier prediction.
» Read more

Do Kepler’s sunspot drawings tell us the length of the solar cycle in the 17th century?

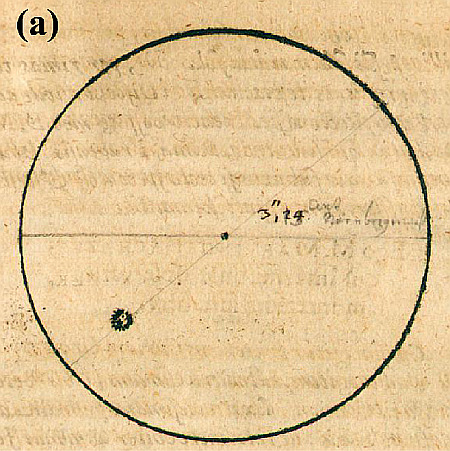
Kepler's first sunspot drawing
Click for original image.

The uncertainty of science: Scientists have done a new analysis of Johannes Kepler’s three drawings of sunspots on the Sun in 1607, and have concluded that the solar cycle at that time — just before the start of the Maunder grand minimum of no sunspots for decades — was about the same length, 11 years, that has been measured since the 1700s onward.

You can read the peer-reviewed paper here. The drawing to the right is figure 1 in that paper, and shows Kepler’s first drawing of the Sun’s surface showing sunspots. From the paper’s conclusion:

In combination with sunspot drawings in the 1610s–1620s, it is reasonable to suppose that the duration of the Solar Cycle −13 was between 11 and 14 yr. This does not support Miyahara et al.’s claim of anomalously long/short durations for Solar Cycle −13 (16 yr) and Solar Cycle −14 (5 yr) but supports Usoskin et al.’s reconstruction of regular durations of Solar Cycle −13 (11 yr) and Solar Cycle −14 (14 yr).

In other words, the solar cycle prior to the sixty-plus yearlong Maunder Minimum, when few to none sunpots occurred, was about eleven years long, like now, and not five years or sixteen years long, as some scientists have theorized. Knowing the length and nature of the cycle before the Maunder grand minimum would help scientists predict when the next minimum might occur. It would also help them better document the Sun’s long term behavior.

There is however great uncertainty in this result, since there really is so little data about sunspots prior to the Maunder Minimum. Before Galileo’s first use of the telescope in astronomy in 1609, such observations like Kepler’s were rare and very difficult. The conclusions here are intriguing, but hardly convincing.

In fact, it is really impossible to get a defiinitive answer from this data. We really won’t know how the Sun behaves just prior to a grand minimum until it happens again and scientists can use modern technology to observe it.

Sunspot update: In May the Sun went boom!

As I have done at the start of every month since I begun this webpage back in 2010, I am posting NOAA’smonthly update of its graph tracking the number of sunspots on the Sun’s Earth-facing hemisphere, adding to it several additional details to provide some larger context.

While April had showed only a small uptick in sunspot activity, in May the sunspot activity on the Sun went boom, setting a new high for sunspots during this solar maximum as well as the highest sunspot count since September 2002. The sunspot count of 171.7 smashed the previous high of 160 this cycle, set in June 2023. This new high underlined was by the large solar flare on May 9th that sent the most powerful geomagnetic storm to hit the Earth’s magnetic field in many decades, producing spectacular auroras in many low latitudes.
» Read more

Solar storms are simply no longer a threat

The sunspot cycle as of May 2024
The sunspot cycle as of May 2024. Click
for full details.

Today’s Chicken Little Report: When NOAA predicted on May 9, 2024 that a powerful solar flare had erupted from the Sun and was aiming a major solar storm directly at the Earth, the scientists at the federal government’s Space Weather Prediction Center could not help underlining the disaster potential, and were ably aided by the mainstream press. This CNN report was typical:

“Geomagnetic storms can impact infrastructure in near-Earth orbit and on Earth’s surface, potentially disrupting communications, the electric power grid, navigation, radio and satellite operations,” according to the Space Weather Prediction Center. “(The center) has notified the operators of these systems so they can take protective action.”

The center has notified operators in these areas to take action to mitigate the potential for any impacts, which include the possibility of increased and more frequent voltage control problems. Other aspects operators will monitor include a chance of anomalies or impacts to satellite operations and frequent or longer periods of GPS degradation.

And as always, the news report has to end with this warning of doom:
» Read more

Sunspot update: A minor uptick in sunspot activity in April

It is that time of the month again. Yesterday NOAA posted its monthly update of its graph tracking the number of sunspots on the Sun’s Earth-facing hemisphere. As I have done now for every month since I began this website in 2010, I have posted this updated graph below, with several additional details to provide some larger context.

In April the number of sunspots on the Sun went up somewhat, the count rising to the highest level since the count hit its peak of activity last summer. The sunspot number in April, 136.5, was however still significantly less than the 2023 peak of 160. Thus it appears the Sun is likely still the middle saddle of a doubled-peaked relatively weak solar maximum, with the Sun doing what I predicted in February 2024:
» Read more

Sunspot update: The weak solar maximum continues

NOAA yesterday posted its updated monthly graph tracking the number of sunspots on the Sun’s Earth-facing hemisphere. As I do every month, I have posted this graph below, with several additional details to provide some larger context.

The sunspot activity in March dropped, continuing the pattern of the last five months, where the Sun appears to be in a stable plateau after reaching a high peak in the summer of 2023. It continues to appear that we are in the middle low saddle of a double-peaked relatively weak solar maximum, with the Sun doing what I predicted in February:

If we are now in maximum, sunspot activity throughout the rest of 2024 should fluctuate at the level it is right now, with it suddenly rising again near the end of the year for a period lasting through the first half of 2025. After that it should begin its ramp down to solar minimum.

» Read more

Sunspot update: The Sun continues what appears will be a weak maximum

As I have done each month since 2011, I am now posting an annotated version of NOAA’s monthly graph, tracking the solar sunspot activity on the Earth-facing hemisphere of the Sun. The NOAA updated graph was posted at the start of March, covering activity through the end of February, so this report is a little later than normal.

That graph is below. In February sunspot activity remained essentially steady, only slightly higher than the activity from the month before. Those numbers also hovered at about the same level seen since August 2023.
» Read more

Sunspot update: The Sun in January acted like solar maximum is here

In my monthly sunspot update at the start of January, I asked in the headline “Are we now in the next solar maximum?”

The Sun’s sunspot activity in January since then has apparently answered that question. NOAA this week posted its monthly update of its graph showing solar sunspot activity on the Sun’s Earth-facing hemisphere, and as I do every month since 2011, I have posted that graph below, with annotations to provide a larger context.
» Read more

Sunspot update: Are we now in the next solar maximum?

Time for my monthly update on the Sun’s sunspot activity has it proceeds through its eleven-year sunspot cycle. NOAA has released its update of its monthly graph showing the number of sunspots on the Sun’s Earth-facing hemisphere, and I have posted it below, annotated with further details to provide a larger context.

In December sunspot activity increased slightly for the second month in a row, but only by a little bit. The number of sunspots for the month was still significantly below the highs seen in the summer, and continue to suggest that the Sun has already entered solar maximum (two years early), and like the previous two solar maximums in 2001 and 2013, will be double peaked.
» Read more

Sunspot update: The Sun continues to prove that solar scientists understand nothing

With today’s monthly update from NOAA of its graph tracking the number of sunspots on the Sun’s Earth-facing hemisphere, we find that the Sun continues to confound the experts. As I do every month, I have posted this graph below, with additional details to provide the larger context.

In November the sunspot count rose slightly, but remained well below the highs that had occurred through most of the first half of 2023. Yet, despite that continuing reduction in the number of sunspots, the overall amount of activity remains above the prediction of some scientists, and below the prediction of other scientists.
» Read more

Sunspot update: October activity drops almost to predicted levels

NOAA today posted its updated monthly graph tracking the number of sunspots on the Sun’s Earth-facing hemisphere. As I do every month, I have posted this graph below, with several additional details to provide some larger context.

In October the sunspot count dropped so much from the activity in September that the total count was for the first time since the middle of 2021 actually very close to the predicted numbers first put forth by NOAA’s solar science panel in April 2020.

» Read more

Sunspot update: Activity rises in September but not significantly

Another month has passed, and it is once again time to post my annotated graph of NOAA’s monthly update of its graph that tracks the number of sunspots on the Sun’s Earth-facing hemisphere. The new graph is posted below, with several additional details to provide some larger context.

Last month we saw a drastic drop in August of sunspot activity, suggesting that the next maximum might possibly have been reached, though many months earlier than predicted. This month’s graph below, which shows an increase in activity in September but still well below the highs seen in June and July, strengthens that conclusion.
» Read more

The sunspot count in August demonstrates fully the utter uncertainty of science

In doing these sunspot updates every month since I started Behind the Black thirteen years ago, one of the repeated common themes has been noting how little we really know about the basic fundamental processes within the Sun. We know the process involves nuclear fusion combined with fission, and that process also creates a powerful magnetic field that every eleven years flips in its polarity. We also know that this eleven year cycle corresponds to an eleven year cycle of rising and then falling sunspot activity.

The devil however is in the details, and we know very little about those details. How those larger processes link to the specific changing features on the Sun remains little understood, if at all. The sudden and entirely unexpected steep drop in sunspot activity in August, as noted in the release yesterday of NOAA’s monthly update of its graph that tracks the number of sunspots on the Sun’s Earth-facing hemisphere, demonstrates this level of ignorance quite starkly.
» Read more

Scientists: Neptune’s clouds appear to ebb and grow in conjunction with sunspot cycle

Graph showing correlation between Neptune's clouds and the sunspot cycle

Scientists have now discovered what appears to be a link between the coming and going of clouds on Neptune to the Sun’s 11-year-long sunspot cycle, despite Neptune receiving only 1/900th the sunlight of the Earth.

To monitor the evolution of Neptune’s appearance, Chavez and her team analyzed images taken from 1994 to 2022 using Keck Observatory’s second generation Near-Infrared Camera (NIRC2) paired with its adaptive optics system (since 2002), as well as observations from Lick Observatory (2018-2019) and the Hubble Space Telescope (since 1994). In recent years the Keck Observatory observations have been complemented by images taken as part of Keck Observatory’s Twilight Observing Program and by Hubble Space Telescope images taken as part of the Outer Planet Atmospheres Legacy (OPAL) program.

The data revealed an intriguing pattern between changes in Neptune’s cloud cover and the solar cycle – the period when the Sun’s magnetic field flips every 11 years, causing levels of solar radiation to fluctuate. When the Sun emits more intense ultraviolet (UV) light, specifically the strong hydrogen Lyman-alpha emission, more clouds appear on Neptune about two years later. The team further found a positive correlation between the number of clouds and the ice giant’s brightness from the sunlight reflecting off it.

“These remarkable data give us the strongest evidence yet that Neptune’s cloud cover correlates with the Sun’s cycle,” said de Pater. “Our findings support the theory that the Sun’s UV rays, when strong enough, may be triggering a photochemical reaction that produces Neptune’s clouds.”

The graph to the right shows the correlation between the clouds and the sunspot cycle. The paper is available here.

This conclusion remains uncertain because of the overall sparseness of the data. Yet, it is intriguing, and also underlines the importance of the Sun on the Earth’s climate. If the solar cycle can impact Neptune’s climate so significantly from 2.8 billion miles away, it certainly must have a major impact on the Earth’s climate at only 100 million miles distance.

Sunspot update: In July the Sun continued its high sunspot activity

Today NOAA released its monthly update of its graph that tracks the number of sunspots on the Sun’s Earth-facing hemisphere. As I have done every month for the entire thirteen years I have been doing this website, I have posted that updated graph below, adding to it some extra details to provide some context.

Though the sunspot count in July was slightly less than the very high numbers in June (the highest seen in more than two decades), the decline was almost inconsequential. Except for June’s activity, the activity in July was still the highest sunspot count in a month since September 2002, when the Sun was just beginning its ramp down after its solar maximum that reached its peak in late 2001. From that time until the last two months, the Sun had been in a very prolonged quiet period, with two solar minimums that were overly long and a single solar maximum that was very weak with a extended double peak lasting almost four years.
» Read more

Sunspot update: June saw the most sunspots in more than two decades

Time for our monthly sunspot update, based on NOAA’s monthly graph that tracks the number of sunspots on the Sun’s Earth-facing hemisphere. I have posted that graph below, but have added some extra details to provide some context.

June saw the highest sunspot count in a month since September 2002, when the Sun was just beginning its ramp down after its solar maximum that reached its peak in late 2001. From that time until now, the Sun has been in a very prolonged quiet period, with two solar minimums that were overly long and a single solar maximum that was very weak with a extended double peak lasting almost four years.
» Read more

Sunspot update: May activity once again far above prediction

With the start of the month it is time once again for our monthly sunspot update, based on the new data that NOAA today added to its own monthly graph that tracks the number of sunspots on the Sun’s Earth-facing hemisphere. I have posted that graph below, but have added some extra details to provide some context.

In May the number of sunspots zipped upward again, ending up at the second highest monthly count during this ramp up to solar maximum, and the second highest count since the last solar maximum in 2014.
» Read more

Sunspot update: April activity drops steeply

NOAA this week once again published an update of its monthly graph that tracks the number of sunspots on the Sun’s Earth-facing hemisphere. As I do every month, I have posted this graph below, with some additional details included to provide some context.

In April the number of sunspots dropped again, for the second time in the past three months. The high activity previously had suggested that the solar maximum was going to be much higher than predicted, or possibly would come sooner than expected. The drop however now suggests that the fast rise in sunspot activity that we have seen since the beginning of the ramp up to solar maximum in 2020 might finally be abating.
» Read more

Scientists predict solar maximum to arrive one year early

The scientists whose prediction of a more active upcoming solar maximum that has so far turned out more accurate than the consensus prediction have now updated their prediction, lowering it somewhat but also predicting the maximum will occur one year early, in 2024 instead of 2025.

The team’s finalized forecast for the current cycle expects it to peak in late 2024, one year earlier than NASA and NOAA had predicted. The cycle, the team thinks, will reach about 185 monthly sunspots during its maximum and thus be somewhat milder than what the team originally forecasted. This peak intensity will place this cycle at about the average compared to the historical record.

In other words, now that we are about halfway to maximum, they have concluded that while NOAA’s prediction was too low, their prediction was too high. They have now adjusted their expectations to be closer to what they now think will happen.

A short solar cycle however has historically corresponded to much higher sunspot activity. If this new prediction is correct (a short cycle with a mild maximum), it will mean that the Sun is still behaving in ways that the solar science community does not understand, or can predict.

Sunspot update: Activity remained high in March

It is time for my monthly sunspot update. NOAA this week updated its graph that tracks the number of sunspots on the Sun’s Earth-facing hemisphere. This graph is posted below, with some additional details included to provide some context.

Last month the number of sunspots dipped slightly after a gigantic leap of activity in January. This month showed a small rise in activity, but not enough to bring levels back to the January’s levels. Nonetheless, activity remains the highest seen since 2014. when the last solar maximum was approaching its end, and continues to exceed significantly the 2020 prediction by NOAA’s panel of solar scientists.
» Read more

Sunspot update: After going through the roof last month, sunspots drop into the attic this month

With the start of another month NOAA this week updated its graph that tracks the number of sunspots on the Sun’s Earth-facing hemisphere. As I do every month, I have posted that updated graph below, adding some additional details to provide some context.

Last month the number of sunspots rocketed upward to the highest seen since 2014, and only the second time since November 2002 that the Sun was that active. In February those high numbers dropped, though the sunspot activity during the month remained well above the 2020 prediction by NOAA’s panel of solar scientists.

» Read more

Sunspot update: The most sunspots since 2014

Time for my monthly sunspot update, based on NOAA’s monthly graph that tracks the number of sunspots on the Sun’s Earth-facing hemisphere. The newest graph, with December’s numbers added to the timeline, is below. As always, I have added some additional details to provide context.

In December the half-year pause in the ramp up to solar maximum ceased, with the Sun seeing the most sunspots since September 2014. This high activity far exceeded the predicted sunspot count for December 2023, almost doubling it. In fact, December’s sunspot count almost equaled the predicted peak for the upcoming solar maximum, which is not supposed to happen until sometime in 2025.

» Read more

Sunspot update: The Sun’s unprecedented pause to maximum continues

It is the beginning of the month, and NOAA has once again published its update of its monthly graph that tracks the number of sunspots on the Sun’s Earth-facing hemisphere. Below is the newest graph, adding November’s numbers to the timeline and annotated by me with some additional details added to provide context.

Sunspot activity dropped in November, though still remained significantly higher than the prediction, a sunspot number of 77.6 compared to the predicted number of 57.4. At 77.6, the Sun continues the pause that began in June in the ramp up to solar maximum. For the past half year the Sun’s sunspot output has essentially stalled at approximately the same level.

» Read more

Sunspot update: The pause in the ramp up to solar maximum continues

NOAA has once again published its monthly update of its monthly graph that tracks the number of sunspots on the Sun’s Earth-facing hemisphere. Below is that November graph, annotated by me with some additional details added to provide context.

Though sunspot number continued to be much higher than the prediction (almost double), October saw almost exactly the same number of sunspots as seen in September, which is why this new graph seems almost identical to last month’s.

In other words, the pause in the ramp up to solar maximum, first noted in August, continues.
» Read more

Sunspot update: Activity again exceeds prediction but ramp up pauses

NOAA this weekend published, as it does at the start of every month, its October update of its monthly graph that tracks the number of sunspots on the Sun’s Earth-facing hemisphere. As I have done since I started this website in 2011, I have published that graph below, with some additional details added to provide context.

An increase in sunspot activity in September wiped out the decline seen in August, so that the sunspot number in September once again matched or exceeded the numbers seen during the middle of the previous solar maximum from 2012 to 2014, a low period of activity between that maximum’s two peaks. Activity also continued to exceed the predictions of the panel of government solar scientists put together by NOAA.

At the same time, since May the ramp up to maximum has stalled, something I noted last month and has now become more evident.
» Read more

Sunspot update: Solar activity continues to exceed sunspot predictions

It is the beginning of September and time to post another update on the Sun’s ongoing solar cycle. Below is NOAA’s monthly graph tracking the number of sunspots on the Sun’s Earth-facing hemisphere, with the activity in August now added. I have also added some additional details to the graph to give the numbers a larger context.

Though sunspot activity dropped in August it remained significantly above the predictions of the panel of government solar scientists put together by NOAA. The predicted sunspot number for August, as indicated by the red curve, was supposed to be about 48. The actual number was 75.

» Read more

1 2 3 7