Click for original image.
The uncertainty of science: Scientists have done a new analysis of Johannes Kepler’s three drawings of sunspots on the Sun in 1607, and have concluded that the solar cycle at that time — just before the start of the Maunder grand minimum of no sunspots for decades — was about the same length, 11 years, that has been measured since the 1700s onward.
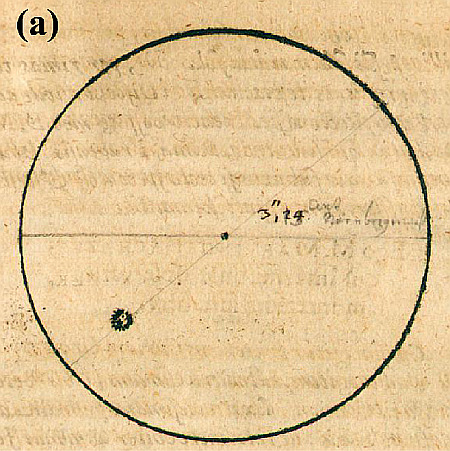
You can read the peer-reviewed paper here. The drawing to the right is figure 1 in that paper, and shows Kepler’s first drawing of the Sun’s surface showing sunspots. From the paper’s conclusion:
In combination with sunspot drawings in the 1610s–1620s, it is reasonable to suppose that the duration of the Solar Cycle −13 was between 11 and 14 yr. This does not support Miyahara et al.’s claim of anomalously long/short durations for Solar Cycle −13 (16 yr) and Solar Cycle −14 (5 yr) but supports Usoskin et al.’s reconstruction of regular durations of Solar Cycle −13 (11 yr) and Solar Cycle −14 (14 yr).
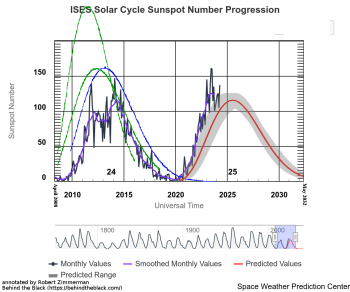
In other words, the solar cycle prior to the sixty-plus yearlong Maunder Minimum, when few to none sunpots occurred, was about eleven years long, like now, and not five years or sixteen years long, as some scientists have theorized. Knowing the length and nature of the cycle before the Maunder grand minimum would help scientists predict when the next minimum might occur. It would also help them better document the Sun’s long term behavior.
There is however great uncertainty in this result, since there really is so little data about sunspots prior to the Maunder Minimum. Before Galileo’s first use of the telescope in astronomy in 1609, such observations like Kepler’s were rare and very difficult. The conclusions here are intriguing, but hardly convincing.
In fact, it is really impossible to get a defiinitive answer from this data. We really won’t know how the Sun behaves just prior to a grand minimum until it happens again and scientists can use modern technology to observe it.