Solar scientists: We finally think we know the location of the Sun’s dynamo
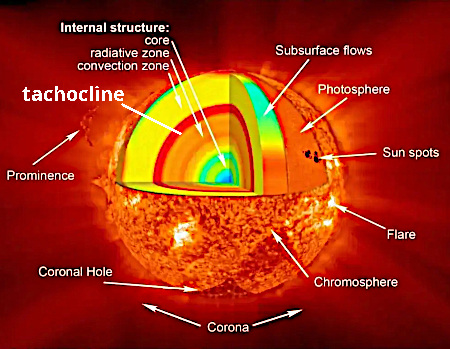
NASA graphic used in the press release and
annotated to post here.
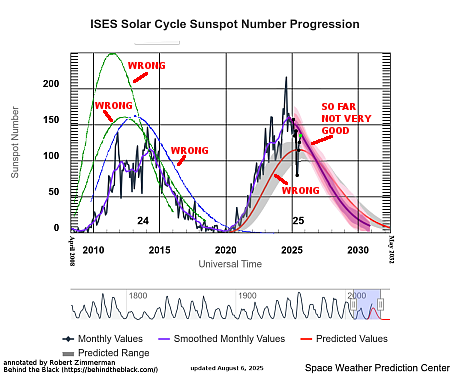
The uncertainty of science: Using three decades of data gathered during the last three solar cycles, scientists now think they have finally determined the location of the Sun’s dynamo in its interior, at a transition point about 125,000 miles below the surface called the tachocline. From the abstract of their paper [pdf]:
The exact location of the solar dynamo remains uncertain–whether it operates primarily in the near-surface shear layer, throughout the entire convection zone, or near the tachocline – a region of sharp transition in the solar rotation, located at the base of the convection zone, approximately 200,000 km [125,000 miles] beneath the surface. Various studies have supported each of these possibilities.
…Our analysis reveals that the gradient of rotation displays ‘butterfly’–like behavior near the tachocline, which is similar to the magnetic butterfly diagram at the surface. This result supports the idea that the solar dynamo has a deep-seated origin, likely operating either near the tachocline or throughout the convection zone, thereby disfavoring the recent scenario of a shallow, near-surface dynamo. This finding may also have important implications for understanding how stellar dynamos operate in general. [emphasis mine]
Even though scientists have known for more than a century that the Sun’s eleven-year cycle of flipping the polarity of its magnetic field is the fundamental cause of the sunspot cycle, they actually know very little about the dynamo that causes that magnetic field, as this study implies. They not only don’t have any understanding of the fundamental processes that creates that dynamo or causes it to flip polarity every eleven years, they still aren’t entirely sure where it is located within the Sun.
Thus, the highlighted sentence above is one large understatement. Of course knowing the dynamos location will have “important implications for understanding stellar dynamics.” This study is a first good stab at the problem, but it also shows us how little we actually know.
Remember this when anyone tells you “the science is settled” about climate change. The Sun is the number one influence on the Earth’s climate, and its solar cycle appears to be an important factor in that influence. Until we have a better understanding of the Sun, its magnetic field, and the dynamo that creates it, no climate prediction will be worth anything. Such predictions will be all guesswork, and likely put forth for political reasons.
NASA graphic used in the press release and
annotated to post here.
The uncertainty of science: Using three decades of data gathered during the last three solar cycles, scientists now think they have finally determined the location of the Sun’s dynamo in its interior, at a transition point about 125,000 miles below the surface called the tachocline. From the abstract of their paper [pdf]:
The exact location of the solar dynamo remains uncertain–whether it operates primarily in the near-surface shear layer, throughout the entire convection zone, or near the tachocline – a region of sharp transition in the solar rotation, located at the base of the convection zone, approximately 200,000 km [125,000 miles] beneath the surface. Various studies have supported each of these possibilities.
…Our analysis reveals that the gradient of rotation displays ‘butterfly’–like behavior near the tachocline, which is similar to the magnetic butterfly diagram at the surface. This result supports the idea that the solar dynamo has a deep-seated origin, likely operating either near the tachocline or throughout the convection zone, thereby disfavoring the recent scenario of a shallow, near-surface dynamo. This finding may also have important implications for understanding how stellar dynamos operate in general. [emphasis mine]
Even though scientists have known for more than a century that the Sun’s eleven-year cycle of flipping the polarity of its magnetic field is the fundamental cause of the sunspot cycle, they actually know very little about the dynamo that causes that magnetic field, as this study implies. They not only don’t have any understanding of the fundamental processes that creates that dynamo or causes it to flip polarity every eleven years, they still aren’t entirely sure where it is located within the Sun.
Thus, the highlighted sentence above is one large understatement. Of course knowing the dynamos location will have “important implications for understanding stellar dynamics.” This study is a first good stab at the problem, but it also shows us how little we actually know.
Remember this when anyone tells you “the science is settled” about climate change. The Sun is the number one influence on the Earth’s climate, and its solar cycle appears to be an important factor in that influence. Until we have a better understanding of the Sun, its magnetic field, and the dynamo that creates it, no climate prediction will be worth anything. Such predictions will be all guesswork, and likely put forth for political reasons.