
Sunspot update: An active October heralds the likely end of solar minimum
With the start of a new month it is once again time to publish another sunspot update. NOAA yesterday updated its monthly graph for tracking the Sun’s monthly sunspot activity. As I have done now every month since this website started in 2011, it is posted below, with additional annotations by me to show the past solar cycle predictions.
Unlike September, which saw almost no sunspots, October was a very active month, with the amount of sunspots far exceeding prediction. Furthermore, every sunspot during the month had a polarity assigning it to the new solar cycle, not the last.
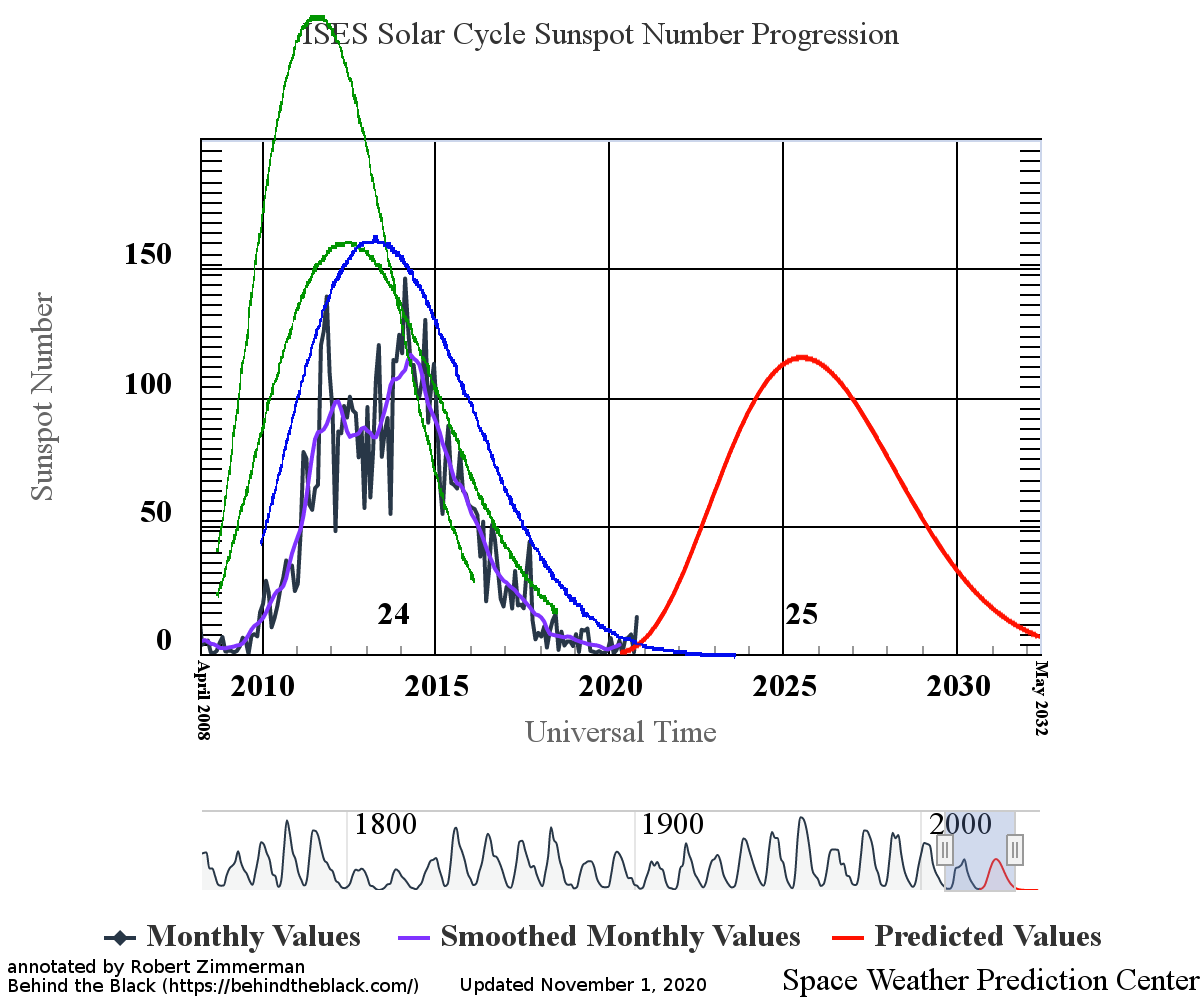
The graph above has been modified to show the predictions of the solar science community for the previous solar maximum. The green curves show the community’s two original predictions from April 2007 for the previous maximum, with half the scientists predicting a very strong maximum and half predicting a weak one. The blue curve is their revised May 2009 prediction. The red curve is the new prediction, first posted by NOAA in April 2020.
All told, October’s activity clearly signaled the beginning of the ramp up to the next solar maximum. The trend line in 2020, since the long unprecedented period late last year with absolutely no sunspots for months, is distinctly upward. While it is also likely that future months will have less activity than October, the future is now pointing to that coming new maximum.
The central scientific question remains: What will be the strength of that maximum? The prediction by NOAA’s solar scientists calls for a weak maximum , weaker than the previous maximum in 2014 and in fact weaker than any in at least a hundred years. While the activity in October suggests the maximum will be stronger than this, no one should take that conclusion very seriously. A close look at the last maximum on the graph shows numerous fluctuations up and down from month to month. October’s burst of activity is merely a reflection of that kind of normal monthly fluctuation.
What the graph does suggest however is that the upcoming prediction is likely going to be more accurate than the past predictions of the previous maximum. During the past maximum the fluctuations rarely exceeded the prediction curves. In general, even the weak prediction from 2009 overestimated sunspot activity.
Though we are very early in the cycle, the activity in 2020 so far suggests that new prediction will get it right this time. We will not really know however for several years. Stay tuned.

On Christmas Eve 1968 three Americans became the first humans to visit another world. What they did to celebrate was unexpected and profound, and will be remembered throughout all human history. Genesis: the Story of Apollo 8, Robert Zimmerman's classic history of humanity's first journey to another world, tells that story, and it is now available as both an ebook and an audiobook, both with a foreword by Valerie Anders and a new introduction by Robert Zimmerman.
The print edition can be purchased at Amazon or from any other book seller. If you want an autographed copy the price is $60 for the hardback and $45 for the paperback, plus $8 shipping for each. Go here for purchasing details. The ebook is available everywhere for $5.99 (before discount) at amazon, or direct from my ebook publisher, ebookit. If you buy it from ebookit you don't support the big tech companies and the author gets a bigger cut much sooner.
The audiobook is also available at all these vendors, and is also free with a 30-day trial membership to Audible.
"Not simply about one mission, [Genesis] is also the history of America's quest for the moon... Zimmerman has done a masterful job of tying disparate events together into a solid account of one of America's greatest human triumphs."--San Antonio Express-News
in very simple terms can you illustrate the impact of more or less sunspots on how it impacts us here on Earth?
Thank you
chris mcdaniel: I’ve written about this many times previously, but you I think are new here.
There is strong circumstantial evidence that when the Sun is less active, with fewer sunspots, the Earth’s climate cools. In the 1600s, the last grand minimum with no sunspots for almost a century, the Earth experienced what has been labeled the Little Ice Age, with some regions literally having no summers a few times and thus crop failures.
Similarly, proxy data of past climate fluctuations align well with proxy data for past periods of low sunspot activity. When there are fewer sunspots, the climate cools. When there are more, the climate warms.
Though we know sunspots form in connection with the Sun’s magnetic field, its dynamo, and its evolution over time, we really do not understand the process at its fundamental level. Thus, we don’t really know why there is a sunspot cycle, or why it seems to shut down every 500 to 1000 years.
We also do not have a good record of fluctuations in the Sun’s radiation across these cycles. Until the late 1970s, we had no record at all for most wavelengths. Only since then have we had satellites above the atmosphere able to track the Sun, across all wavelengths, during its entire sunspot cycle. Since then however there have only been about five cycles, hardly a long enough sample to really come to any solid conclusions.
There is one good theory that attempts to explain the link between the climate and sunspots, though it remains unconfirmed. An active Sun acts to block cosmic rays from reaching the Earth. During maximums the cosmic ray flux drops. During minimums and grand minimums the flux rises.
Physicists have found that cosmic rays hitting the upper atmosphere might increase cloud cover. When more cosmic rays get through during long periods of few sunspots, we would thus have more clouds, reflecting sunlight away and thus cooling the climate. See the video at this post for a full explanation.
I hope that helps.
How truly disappointed will climate change zealots be when the full truth of the suns influence is learned. The sun has been for millions of years. How do we know, how can we predict, when the sun will dim a little, or brighten a little and for how long? We still don’t know why the earth had multiple ice ages, how they began and then ended. Our ability to examine the sun with all spectrums is young, very very young compared to the life of our sun. We may learn (one day, maybe) the full behavior of the sun. Till then, sunscreen with the top down, and enjoy the drive!
Seeing some great sunspots now in early November. If this will reduce the general “extra” cloud in the west of North America we have seen since 2009, this amature astronomer will be pleased.
However, the information which might be gained from a long low maximum will be very informative to solar dynamicists. Sooo, I am of two minds of what to hope for. Guess I will have to wait and see.