
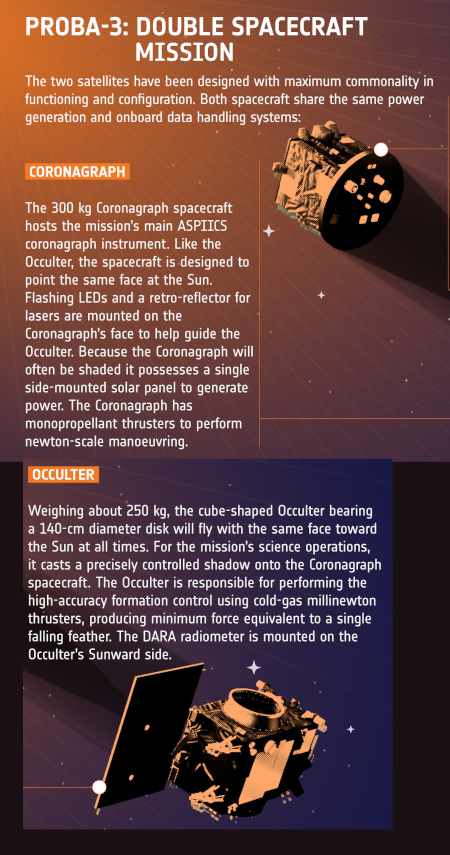
Scientists: First data from Europe’s Proba-3 satellites suggest the Sun’s slow solar wind is faster and more chaotic than expected
Click for original image.
The uncertainty of science: According to the first published paper [pdf] from Europe’s two Proba-3 satellites, scientists have found the slow solar wind that comes from the Sun is sometimes far faster than expected, and is also far more chaotic. From the second link above:
Just like wind on Earth, solar wind can be fast or slow, smooth or gusty. Fast solar wind usually flows in a smooth current from magnetic structures called coronal holes. In contrast, slow solar wind is variable and gusty, making understanding how it works more difficult.
Scientists think that slow solar wind is generated by the Sun’s magnetic field lines changing how they are connected, merging and separating again. This process pushes out blobs of plasma (electrically charged gas) in so-called ‘streamers’: large, bright rays in the corona.
…Previously, scientists found that close to the Sun’s surface, slow solar wind should have speeds around 100 km/s. Instead, Andrei’s team tracked some blobs of plasma moving at 250–500 km/s.
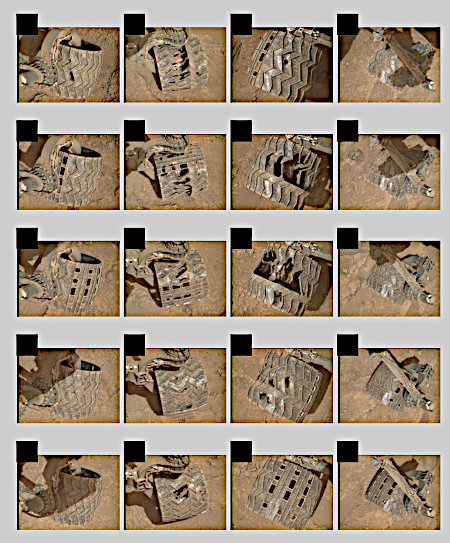
The graph to the right, Figure 4 in the paper, shows Proba-3’s tracking of a variety of these blobs. Not only did some move faster than expected (the arrows above the gray line marking earlier data), their speeds changed with time, with some actually speeding up.
The reason the Sun’s fast wind is relatively stable is that it emanates from magnetic structures dubbed coronal holes because the magnetic field lines there are is somewhat calm and stable. The slow wind meanwhile comes out through much more active and unstable regions of the magnetic field, with its field lines jumping about as well as connecting and unconnecting from the field’s structure in a chaotic manner.
This research suggests that the slow wind is chaotic and thus unpredictable, almost like the weather on Earth.

Click for original image.
The uncertainty of science: According to the first published paper [pdf] from Europe’s two Proba-3 satellites, scientists have found the slow solar wind that comes from the Sun is sometimes far faster than expected, and is also far more chaotic. From the second link above:
Just like wind on Earth, solar wind can be fast or slow, smooth or gusty. Fast solar wind usually flows in a smooth current from magnetic structures called coronal holes. In contrast, slow solar wind is variable and gusty, making understanding how it works more difficult.
Scientists think that slow solar wind is generated by the Sun’s magnetic field lines changing how they are connected, merging and separating again. This process pushes out blobs of plasma (electrically charged gas) in so-called ‘streamers’: large, bright rays in the corona.
…Previously, scientists found that close to the Sun’s surface, slow solar wind should have speeds around 100 km/s. Instead, Andrei’s team tracked some blobs of plasma moving at 250–500 km/s.
The graph to the right, Figure 4 in the paper, shows Proba-3’s tracking of a variety of these blobs. Not only did some move faster than expected (the arrows above the gray line marking earlier data), their speeds changed with time, with some actually speeding up.
The reason the Sun’s fast wind is relatively stable is that it emanates from magnetic structures dubbed coronal holes because the magnetic field lines there are is somewhat calm and stable. The slow wind meanwhile comes out through much more active and unstable regions of the magnetic field, with its field lines jumping about as well as connecting and unconnecting from the field’s structure in a chaotic manner.
This research suggests that the slow wind is chaotic and thus unpredictable, almost like the weather on Earth.


