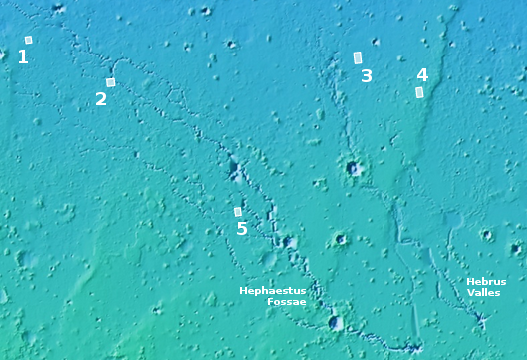
OSIRIS-REx spots sun-caused erosion on Bennu
Click for full figure.
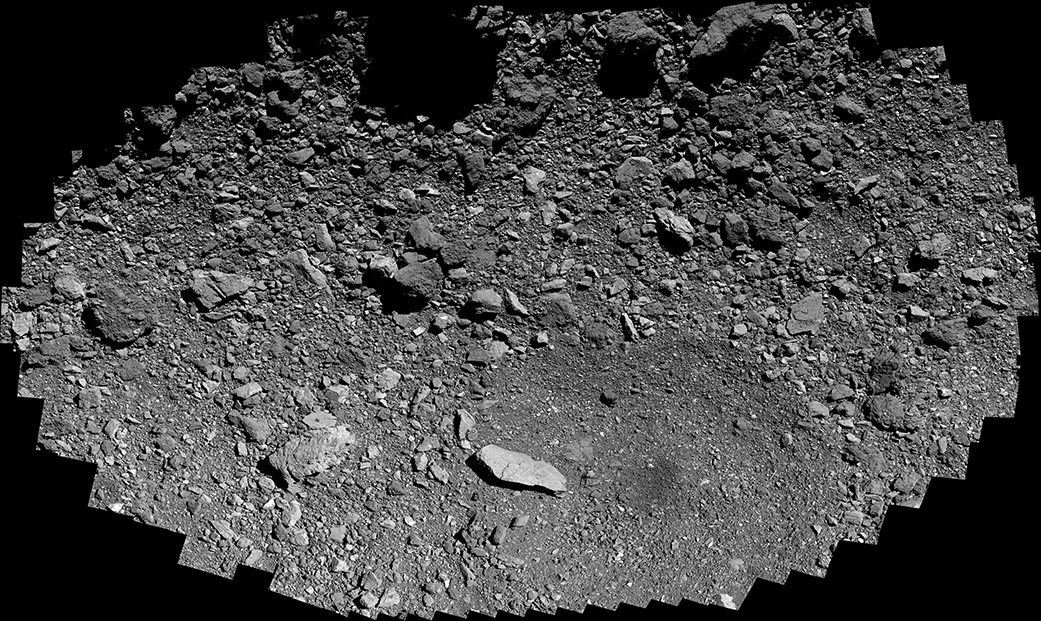
An analysis of images taken by OSIRIS-REx of the asteroid Bennu has allowed scientists to identify places where the changing temperatures from day to night has caused the surfaces of rocks to flake away, a process geologists label exfoliation.
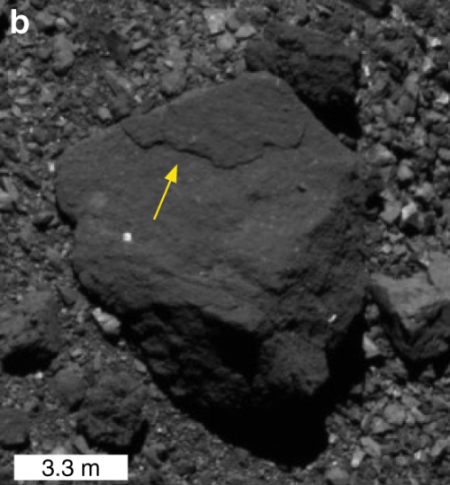
The image on the right, cropped and reduced to post here, is from figure 1 in the paper. The yellow arrow points to a typical example of exfoliation, which is a process you can see on many rocks here on Earth.
Rocks expand when sunlight heats them during the day and contract as they cool down at night, causing stress that forms cracks that grow slowly over time. Scientists have thought for a while that thermal fracturing could be an important weathering process on airless objects like asteroids because many experience extreme temperature differences between day and night, compounding the stress. For example, daytime highs on Bennu can reach almost 127 degrees Celsius or about 260 degrees Fahrenheit, and nighttime lows plummet to about minus 73 degrees Celsius or nearly minus 100 degrees Fahrenheit. However, many of the telltale features of thermal fracturing are small, and before OSIRIS-REx got close to Bennu, the high-resolution imagery required to confirm thermal fracturing on asteroids didn’t exist.
The mission team found features consistent with thermal fracturing using the spacecraft’s OSIRIS-REx Camera Suite (OCAMS), which can see features on Bennu smaller than one centimeter (almost 0.4 inches). It found evidence of exfoliation, where thermal fracturing likely caused small, thin layers (1 – 10 centimeters) to flake off of boulder surfaces. The spacecraft also produced images of cracks running through boulders in a north-south direction, along the line of stress that would be produced by thermal fracturing on Bennu.
The typical erosion processes that can cause exfoliation (weather, gravity) are not possible on tiny Bennu, so the solution appears to rest with sunlight and sunlight alone.
This is not really a surprising result, but it is the first time it has been documented by data.