The link between sunspots and climate

In a preprint paper published today on the Los Alamos astro-ph website and accepted for publication in the Journal of Atmospheric and Solar-Terrestrial Physics, Norwegian scientists have found a strong correlation between the length of the solar sunspot cycle and the Earth’s temperature during the following cycle. From the abstract:

Relations between the length of a sunspot cycle and the average temperature in the same and the next cycle are calculated for a number of meteorological stations in Norway and in the North Atlantic region. No significant trend is found between the length of a cycle and the average temperature in the same cycle, but a significant negative trend is found between the length of a cycle and the temperature in the next cycle. This provides a tool to predict an average temperature decrease of at least 1.0 ◦ C from solar cycle 23 to 24 for the stations and areas analyzed. We find for the Norwegian local stations investigated that 25–56% of the temperature increase the last 150 years may be attributed to the Sun. For 3 North Atlantic stations we get 63–72% solar contribution. [emphasis mine]

You can download a copy of the paper here [pdf].

Their paper finds that if a particular sunspot cycle is longer with less activity, the climate will show significant cooling during the next cycle.

The paper makes several important points:
» Read more

Data issued last week without fanfare by both the UK’s Met Office and the University of East Anglia Climatic Research Unit has confirmed that the rising trend in world temperatures ended in 1997.

Data issued last week without fanfare by both the UK’s Met Office and the University of East Anglia Climatic Research Unit has confirmed that the rising trend in world temperatures ended in 1997.

The article also discusses at great length the additional influence the sun and its sunspot cycle might have on the climate, something I have discussed here at great length. However, the above factoid is the article’s most important data point.

A fired up Sun

As it does every month, NOAA’s Space Weather Prediction Center today released its monthly update showing the ongoing changes of the Sun’s solar cycle sunspot activity. I have posted the graph below the fold.

For the fourth month in a row the Sun’s sunspot activity has leaped upward. In fact, for the first time since I have been tracking sunspot activity, beginning in 2008, the Sun’s sunspot activity exceeds the predicted activity by a significant amount. Since the end of the previous maximum, the Sun had consistently failed to meet the expectations of solar scientists by producing far fewer sunspots than expected.

In the past few months, however, the Sun has recovered, its activity firing upward, including some of the most active and largest sunspots in years.
» Read more

The sun’s activity goes boom

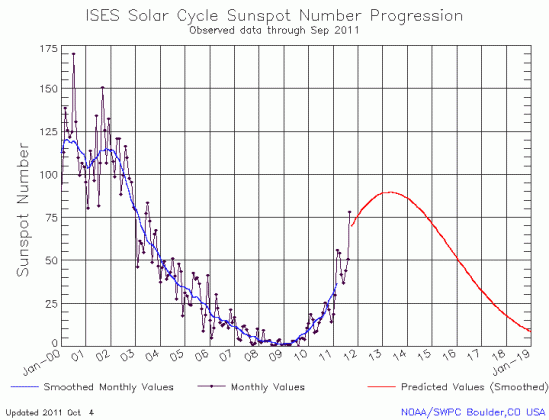
Today NOAA’s Space Weather Prediction Center released its monthly graph of the Sun’s solar cycle sunspot activity. Posted below, it shows the Sun’s activity finally leaping upward in September, after several months of less than expected performance.

It is interesting to see how the sun’s rising sunspot activity for the past year has followed a consistent fluctuating pattern, whereby a sudden monthly jump in sunspots is then followed by several months of decline. If this pattern repeats itself again, we should expect to see the numbers ease off again in October and November.

Regardless, the higher sunspot counts for September are more in line with past predictions. In fact, the solar scientists at the Marshall Space Flight Center have increased their prediction for the time and intensity for the peak of the sun’s maximum. Last month they had called for a peak in May 2013 with a sunspot number of 70. Now, they are predicting the peak will come in April 2013 with a number of 77. They note however that even this higher number will result in the weakest maximum in more than a hundred years.

September sunspot graph

The sun’s weak maximum continues

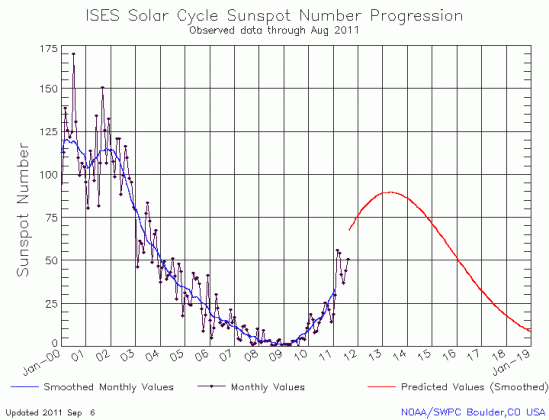
The monthly graph from NOAA’s Space Weather Prediction Center of the Sun’s solar cycle sunspot activity is out and I have posted it below. Though activity increased for the second month in a row, the totals are still below the activity levels of March and April 2011.

I am beginning to think that I sound like a broken record. This monthly graph once again suggests that the next solar maximum will be weak, possibly weaker than the most up-to-date predictions for the next solar maximum. And even if that prediction is correct, the data continues to point towards a quieter Sun, with the likelihood of a long period of no sunspots beginning in the next decade.

Based on past history, the consequences of a long Maunder-type minimum, where there are no sunspots for decades, should be very profound. Every time the Sun has gone this quiet in the past, the Earth’s climate has cooled. Furthermore, new results just released add weight to this conclusion. A less active Sun allows more intergalactic cosmic rays to hit the atmosphere, and the CLOUD experiment at CERN strongly suggests that the higher rate of cosmic rays could in turn increase the atmosphere’s cloudiness, thereby reflecting more light and energy and making the Earth colder.

The sunspot graph for August 2011

1 5 6 7