
Experimental NASA high altitude balloon circles Antarctica in ten days
Click for original image.
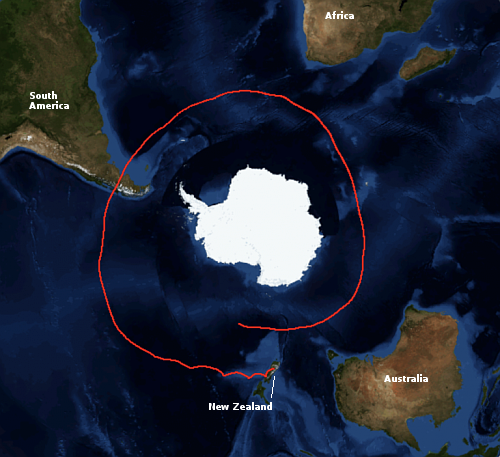
An experimental NASA high altitude balloon has successfully circled the continent of Antarctica in only ten days, flying at an average elevation of 107,000 feet.
The overview map to the right, annotated for posting here, shows its flight path so far.
“The balloon is performing exactly the way it was engineered to do, maintaining its shape and flying at a stable altitude despite the heating and cooling of the day-night cycle,” said Debbie Fairbrother, NASA’s Scientific Balloon Program chief. “As we continue to test, validate, and qualify this technology for future flights we’re also performing some cutting-edge science.”
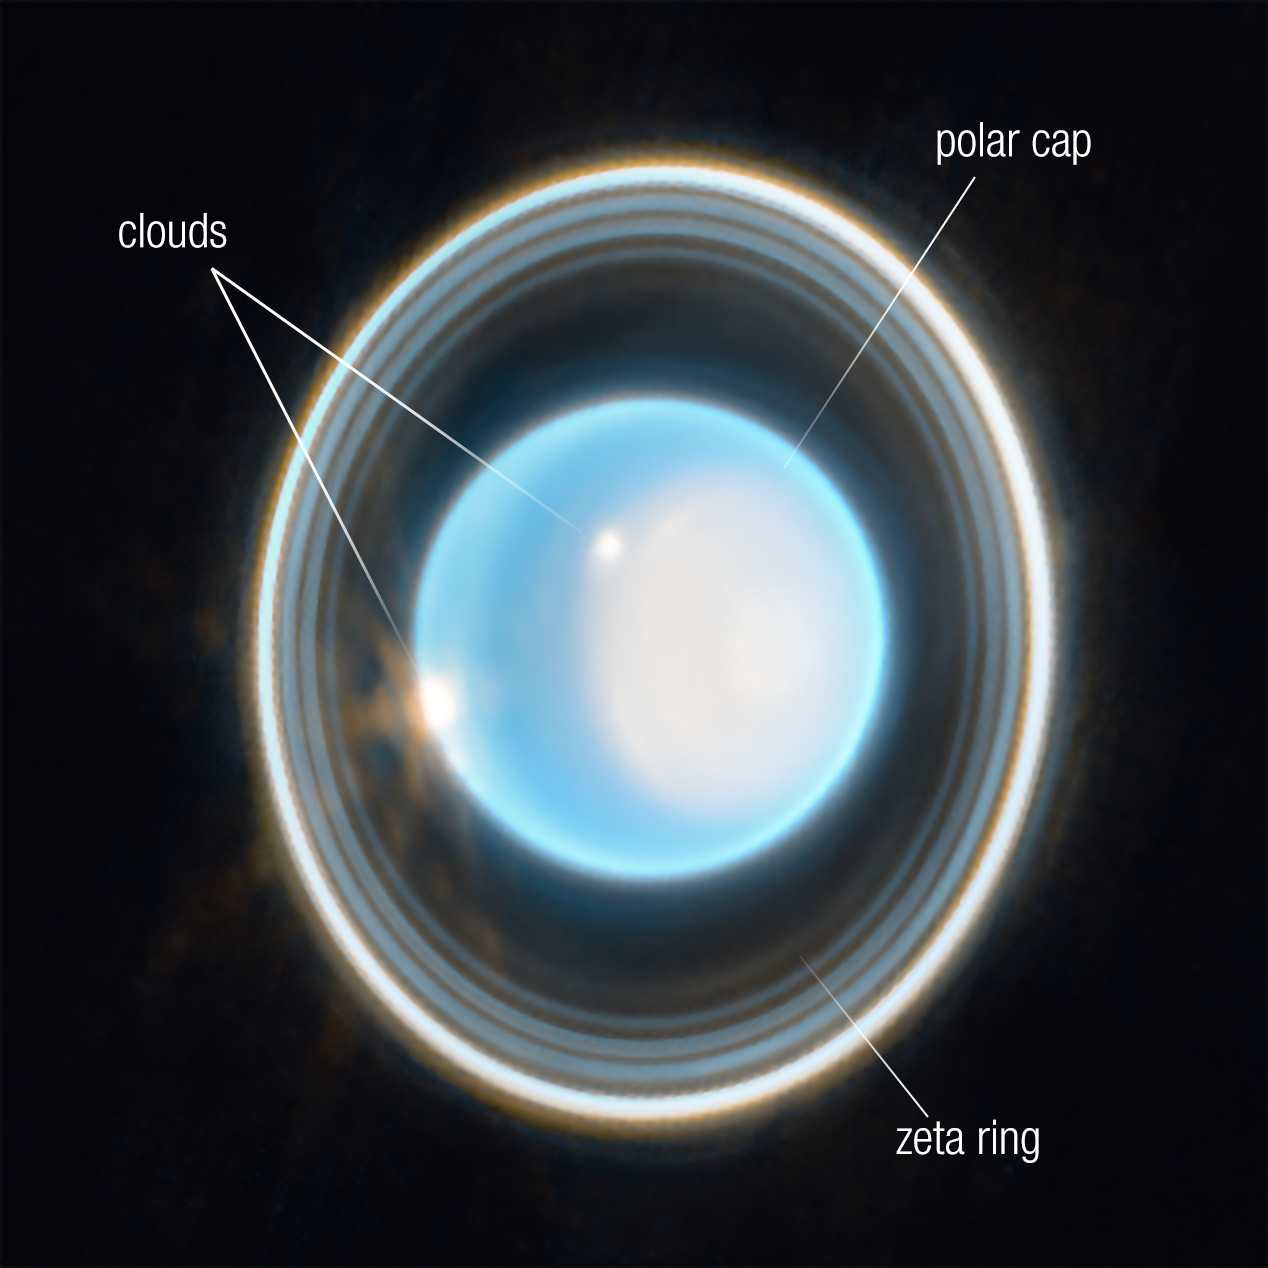
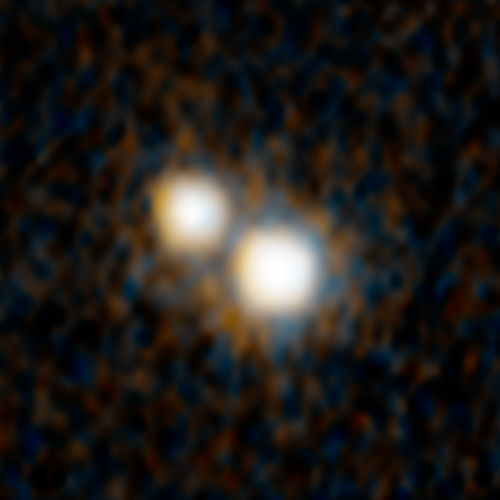
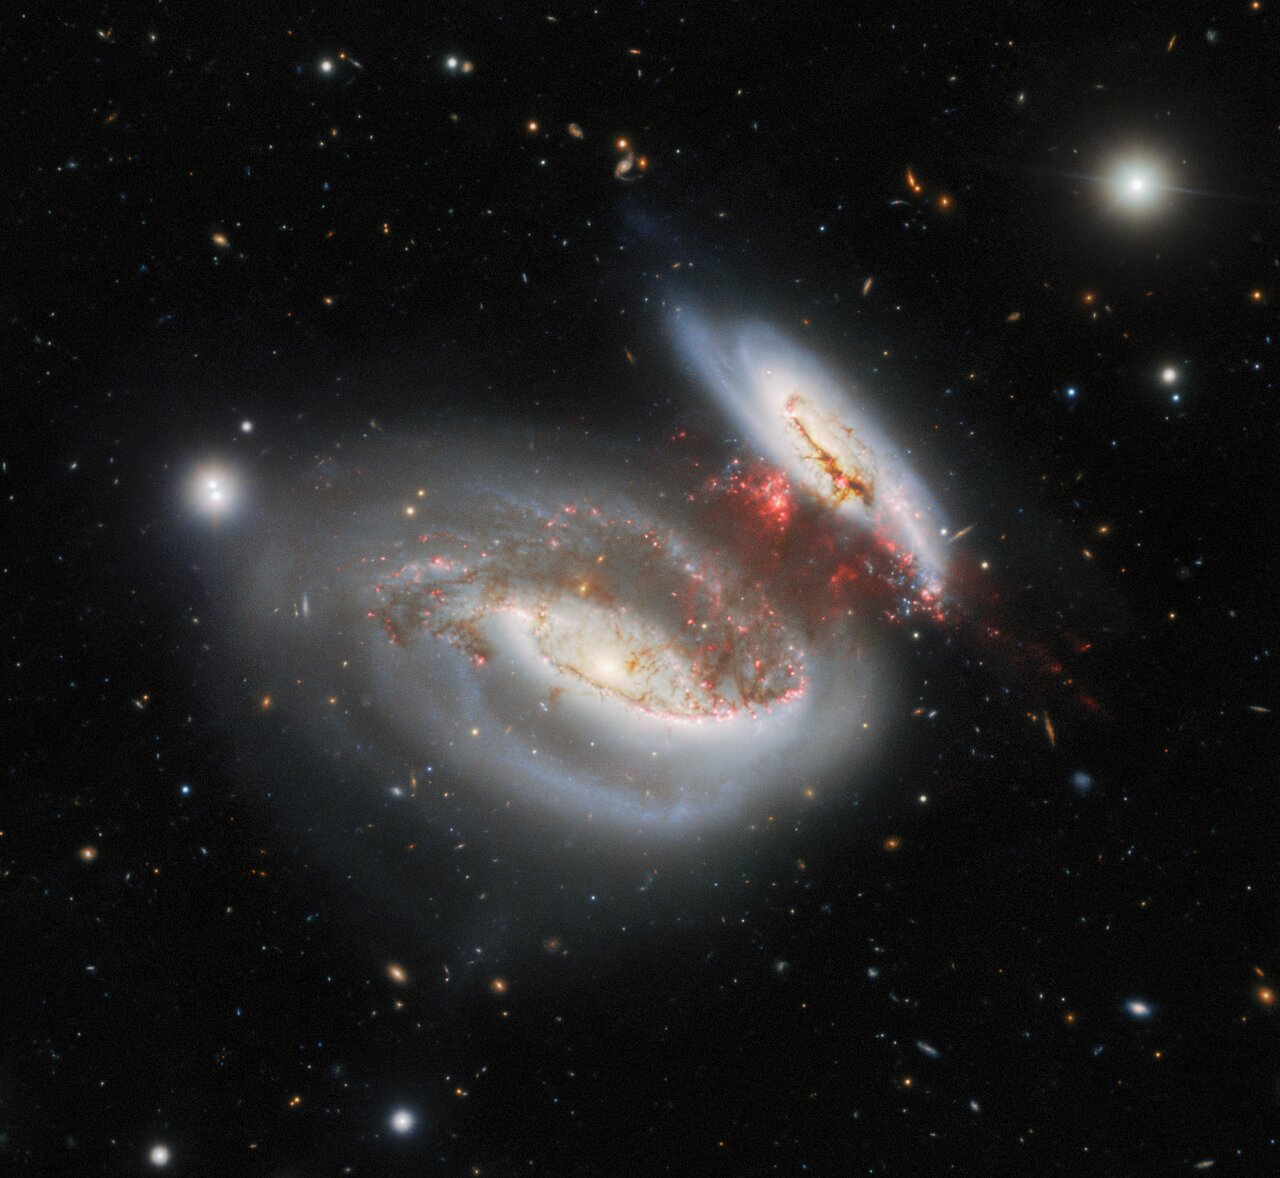
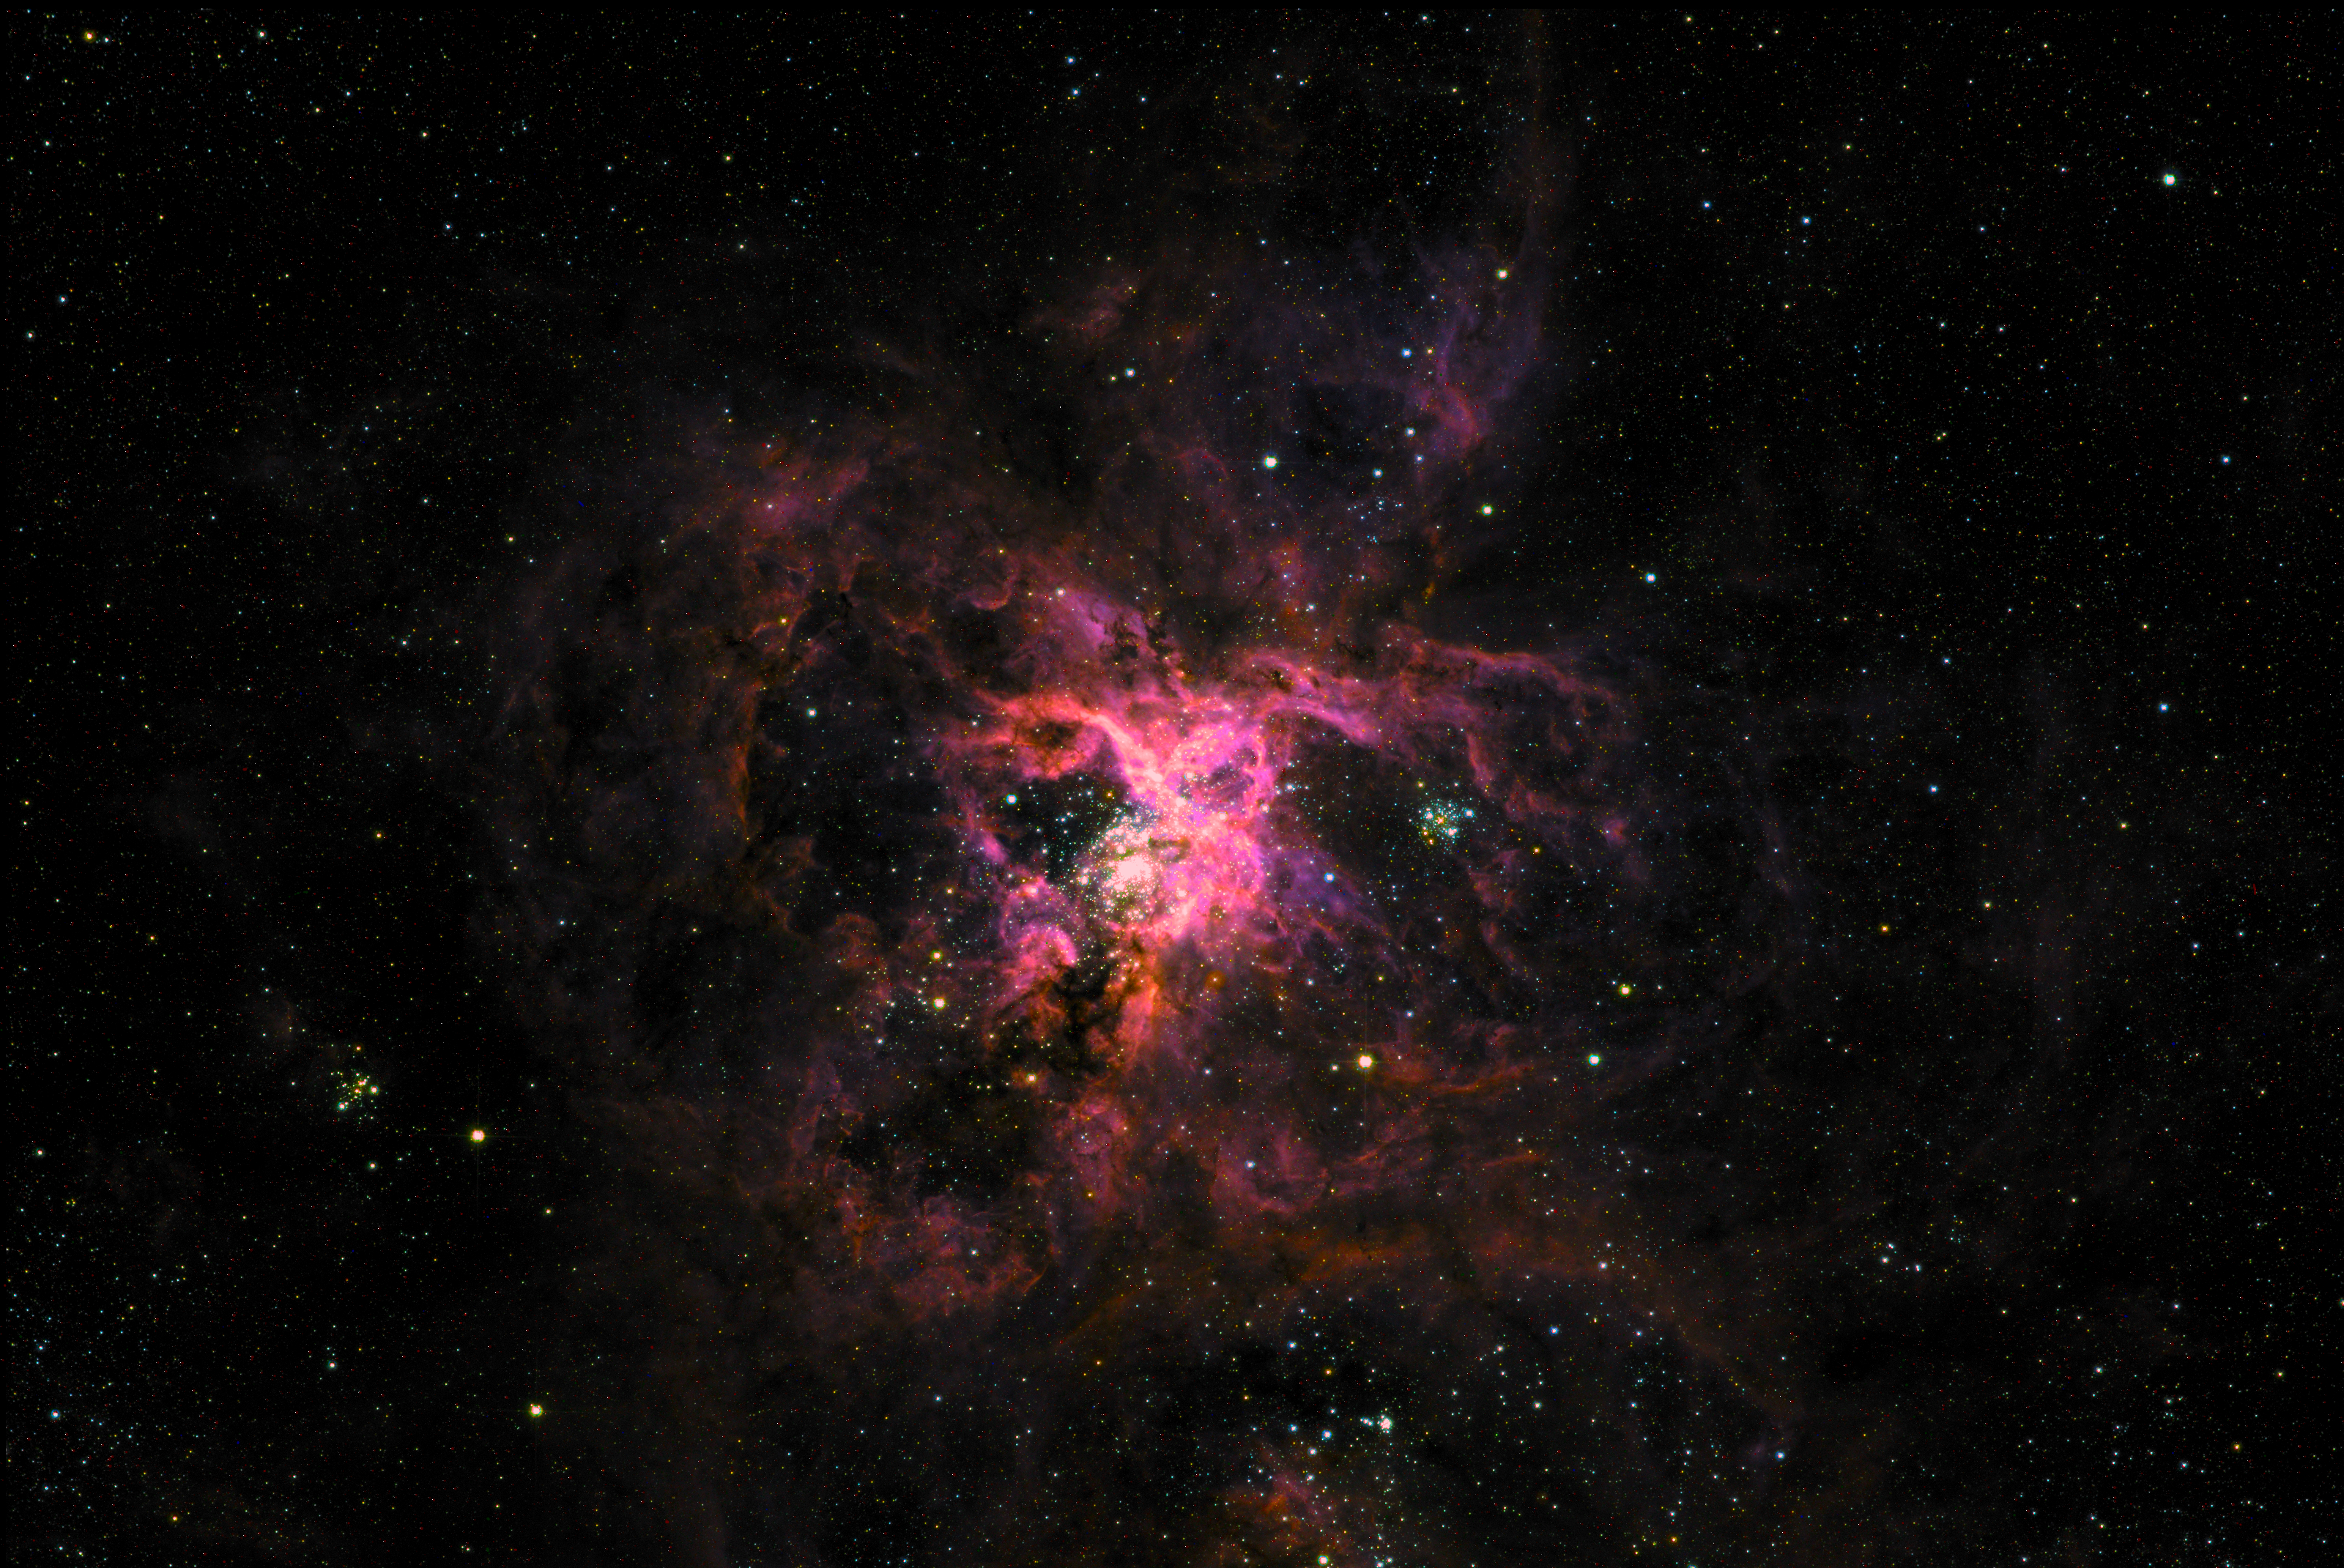
The balloon is flying the Super Pressure Balloon Imaging Telescope (SuperBIT) payload, which has already returned brilliant research images from this flight.
Weather permitting, the balloon can be seen from the ground, especially at sunrise and sunset, as it continues on its globetrotting journey. People can track the real-time location of NASA’s super pressure balloon at this website: https://www.csbf.nasa.gov/map/balloon10/flight728NT.htm
The images have so far been of astronomical objects, such as the Antennae galaxy and the Tarantula nebula. Being so high above the atmosphere, the pictures are sharper than ground-based telescopes and have a much wider field of view.
The press release did not state how long this flight will last, but it did mention a second balloon mission is planned, flying a European cosmic-ray detector.

Click for original image.
An experimental NASA high altitude balloon has successfully circled the continent of Antarctica in only ten days, flying at an average elevation of 107,000 feet.
The overview map to the right, annotated for posting here, shows its flight path so far.
“The balloon is performing exactly the way it was engineered to do, maintaining its shape and flying at a stable altitude despite the heating and cooling of the day-night cycle,” said Debbie Fairbrother, NASA’s Scientific Balloon Program chief. “As we continue to test, validate, and qualify this technology for future flights we’re also performing some cutting-edge science.”
The balloon is flying the Super Pressure Balloon Imaging Telescope (SuperBIT) payload, which has already returned brilliant research images from this flight.
Weather permitting, the balloon can be seen from the ground, especially at sunrise and sunset, as it continues on its globetrotting journey. People can track the real-time location of NASA’s super pressure balloon at this website: https://www.csbf.nasa.gov/map/balloon10/flight728NT.htm
The images have so far been of astronomical objects, such as the Antennae galaxy and the Tarantula nebula. Being so high above the atmosphere, the pictures are sharper than ground-based telescopes and have a much wider field of view.
The press release did not state how long this flight will last, but it did mention a second balloon mission is planned, flying a European cosmic-ray detector.


