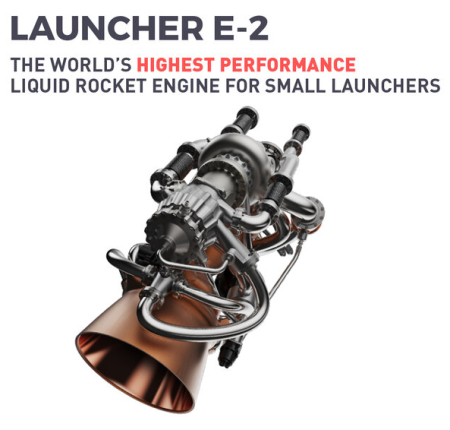
Launcher’s 3D printed E2 engine, claimed by the company
to be the highest performance engine for small rockets.
Capitalism in space: Three stories today underlined superbly the robust and steadily growing state of the commercial space industry. Moreover, these stories suggest that this growth will be permanent with almost no limit to its possibilities.
To begin, we have the public appearance of another startup smallsat rocket company, dubbed Launcher.
Small launch vehicle developer Launcher has raised $11.7 million in a Series A funding round, which the company says puts it on a path to reaching orbit with a fraction of the total investment of other launch startups. Launcher said June 2 that the Series A round was co-led by Boost.VC and the company’s founder, Max Haot, both of whom earlier provided seed funding to the startup. Haot invested $5 million using proceeds of a camera company, Mevo.com, that he sold earlier this year to Logitech. Other existing and new investors also participated in the round, which Haot told SpaceNews was oversubscribed.
…Launcher is working on a small launch vehicle called Launcher Light, intended to be similar in performance to Rocket Lab’s Electron, which can place up to 300 kilograms into low Earth orbit. Launcher Light is a smaller version of Rocket-1, the company’s original vehicle, which Haot said in March should speed up development since it will require fewer engines.
The company hopes to launch by ’24, and is also planning another fund-raising round next year to raise an additional $40 million.
Considering the large number of new rocket companies raising capital, who knows if this company will make it. Certainly some will grab market share and survive, but more likely in the coming decade there will be a shake-out where many will either consolidate or disappear, similar to what happened in the early days of the automobile industry.
That so many similar new rocket companies are attracting so many investors however shows that people with money are now convinced that space is the place, and the future there is very bright for profit. And what lends weight to this sentiment are the other two stories today, both of which involve new space startups that are not rocket companies but the kind of ground facilities required by the satellites those rockets launch.
» Read more