
The Sun goes quiet! Sunspot update for November 2017
The past month was the most inactive month for sunspots since the middle of 2009, when the last solar minimum was just ending and the Sun was beginning its ramp up to solar maximum.
NOAA on Sunday posted its monthly update of the solar cycle, covering sunspot activity for November. As I have done every month since 2010, I have posted that graph below, with annotations.
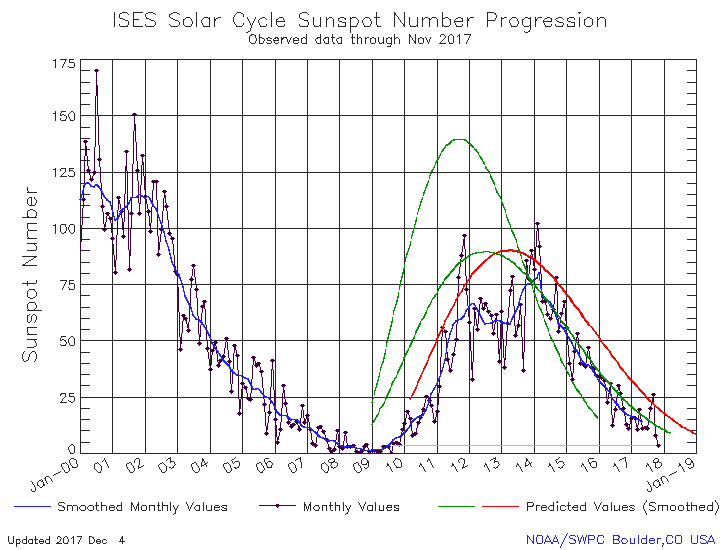
The graph above has been modified to show the predictions of the solar science community. The green curves show the community’s two original predictions from April 2007, with half the scientists predicting a very strong maximum and half predicting a weak one. The red curve is their revised May 2009 prediction.
I have also added a straight yellow line near the bottom of the graph, indicating how the lack of activity this past month corresponds with the lack of activity in the summer of 2009, just when that unusually long and deep solar minimum was beginning to end.
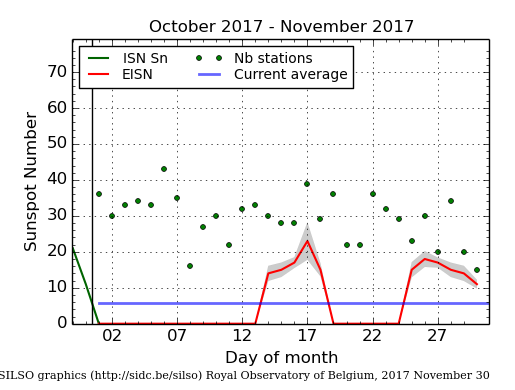
To get an idea how few sunspots were seen in November, the graph on the right, produced by SILSO (Sunspot Index and Long-term Solar Observations) on December 1, shows only 10 days during the entire month when any sunspots were active on the Sun’s visible hemisphere. And even those sunspot were few and weak, resulting in tiny sunspot numbers total.
Nor is December looking any different, with no sunspots recorded so far, four days into the month.
The plunge to solar minimum continues to appear to be happening faster than normal. At this pace, solar minimum will arrive in early 2018, making this one of the shortest solar cycles on record. That in itself would be unprecedented, as short cycles in the past have always accompanied very active solar maximums, not weak maximums like the maximum we have just seen.
I still expect the ramp down to solar minimum to slow down and stretch out to 2019, as would be more normal, but I also would not bet any money on this expectation, at this point.
The big question remains: Will the solar cycle continue as normal after this upcoming solar minimum, or will we instead see our first grand minimum since the Maunder Minimum in the 1600s, a period lasting for about a century with no obvious sunspots that also corresponded to the Little Ice Age?

On Christmas Eve 1968 three Americans became the first humans to visit another world. What they did to celebrate was unexpected and profound, and will be remembered throughout all human history. Genesis: the Story of Apollo 8, Robert Zimmerman's classic history of humanity's first journey to another world, tells that story, and it is now available as both an ebook and an audiobook, both with a foreword by Valerie Anders and a new introduction by Robert Zimmerman.
The print edition can be purchased at Amazon or from any other book seller. If you want an autographed copy the price is $60 for the hardback and $45 for the paperback, plus $8 shipping for each. Go here for purchasing details. The ebook is available everywhere for $5.99 (before discount) at amazon, or direct from my ebook publisher, ebookit. If you buy it from ebookit you don't support the big tech companies and the author gets a bigger cut much sooner.
The audiobook is also available at all these vendors, and is also free with a 30-day trial membership to Audible.
"Not simply about one mission, [Genesis] is also the history of America's quest for the moon... Zimmerman has done a masterful job of tying disparate events together into a solid account of one of America's greatest human triumphs."--San Antonio Express-News
All the spots since 2009 gone already ?
There you see, Trump cleans the swamp from the top.
LocalFluff asked, “All the spots since 2009 gone already?”
I don’t really understand your question, and am not sure if you are just being silly. Sunspots only last at most a month or two, usually much shorter. However, the number of sunspots on the sun’s visible hemisphere last month matched the number of sunspots on the sun’s visible hemisphere in 2009, the moment when the last solar minimum was about to end.
It would seem we should look more closely at the scientists who predicted (in 2007) the lower rate which corresponds quite nicely to the data collected. They knew something the rest were not willing to say?
I wish you would have said “straight yellow line” instead of “yellow line”. I must have looked at the chart for at least five minutes looking for a curved line like all the others. It was when I saw “green lines” (plural) in the description that I realized I wasn’t experiencing a bout of being color blind and that I should look elsewhere for a yellow line. Yeah, it’s just me, but I couldn’t resist describing my bout of confusion.
Willi: I have revised my post slightly to make it clearer. Thank you.
Fascinating stuff, Robert, thank you!
Maunder Minimum slowly approaches?