Sunspot update July 2019: Almost no sunspots
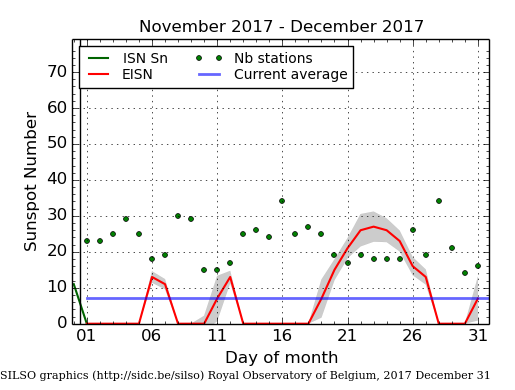
Time for my monthly sunspot update. Below is the July graph of sunspot activity released by NOAA yesterday, annotated to give it some context.
July was about as inactive as June, with only two sunspots appearing during the entire month. As with June, one of those sunspots had the polarity for the next solar maximum, signaling once again the beginning of the next cycle.

The graph above has been modified to show the predictions of the solar science community for the previous solar maximum. The green curves show the community’s two original predictions from April 2007, with half the scientists predicting a very strong maximum and half predicting a weak one. The red curve is their revised May 2009 prediction, extended in November 2018 four years into the future.
We have now seen sunspots with a polarity matching the next solar cycle for two months in a row. In every case those sunspots were weak, lasting only a day or so, but they were visible and trackable, more evidence that we will not see a grand minimum in the coming decade. Whether the next cycle will be weak or not remains unknown, though the data suggests it will be weak.
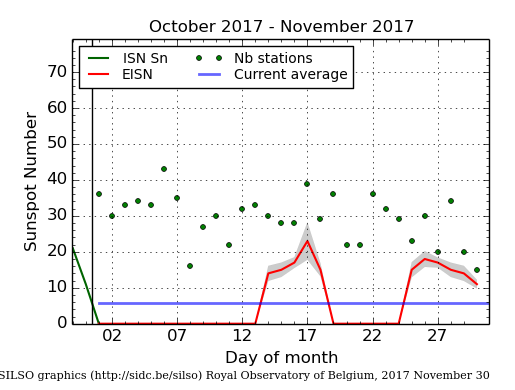
Time for my monthly sunspot update. Below is the July graph of sunspot activity released by NOAA yesterday, annotated to give it some context.
July was about as inactive as June, with only two sunspots appearing during the entire month. As with June, one of those sunspots had the polarity for the next solar maximum, signaling once again the beginning of the next cycle.
The graph above has been modified to show the predictions of the solar science community for the previous solar maximum. The green curves show the community’s two original predictions from April 2007, with half the scientists predicting a very strong maximum and half predicting a weak one. The red curve is their revised May 2009 prediction, extended in November 2018 four years into the future.
We have now seen sunspots with a polarity matching the next solar cycle for two months in a row. In every case those sunspots were weak, lasting only a day or so, but they were visible and trackable, more evidence that we will not see a grand minimum in the coming decade. Whether the next cycle will be weak or not remains unknown, though the data suggests it will be weak.