Click for original movie.
Launched in early 2024, the Pace orbiter was designed to track the evolution of the leaves of trees globally throughout the entire year. NASA has now released the data from the first twelve months, showing the seasonal changes of trees as the Earth rotates the Sun and the seasons change globally.
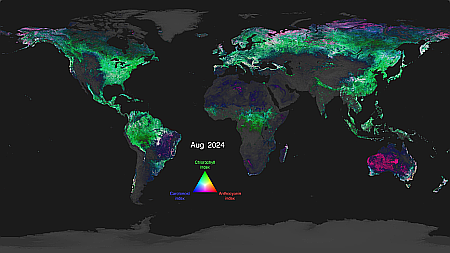
The map to the right is a screen capture from one of many videos showing these changes. The green indicates the global spread of tree cover in the middle of August in the northern hemisphere as well as in the equatorial regions of South America and Africa. Other movies focusing on North America, South America, Europe, India, etc, can be viewed here.
PACE measurements have allowed NASA scientists and visualizers to show a complete year of global vegetation data using three pigments: chlorophyll, anthocyanins, and carotenoids. That multicolor imagery tells a clearer story about the health of land vegetation by detecting the smallest of variations in leaf colors.
…Anthocyanins are the red pigments in leaves, while carotenoids are the yellow pigments – both of which we see when autumn changes the colors of trees. Plants use these pigments to protect themselves from fluctuations in the weather, adapting to the environment through chemical changes in their leaves. For example, leaves can turn more yellow when they have too much sunlight but not enough of the other necessities, like water and nutrients. If they didn’t adjust their color, it would damage the mechanisms they have to perform photosynthesis.
In the visualization, the data is highlighted in bright colors: magenta represents anthocyanins, green represents chlorophyll, and cyan represents carotenoids. The brighter the colors are, the more leaves there are in that area. The movement of these colors across the land areas show the seasonal changes over time.
You can read the full paper describing the first year’s data here.
The Trump budget presently funds Pace for two more years of observations, at about $26 million per year. This is an obvious example of a satellite whose life should be extended for as long as possible. This long term data would likely confirm other data that indicates the increase in CO2 in the atmosphere is greening the Earth, helping plant life that provides us oxygen to breath and food to eat.
To do so, however, other cuts in NASA will have to be found to pay for that extension. I once again wonder about the half a billion NASA spends for its “Mission Enabling Services”, which covers NASA’s human resources division, public relations department, and its equal opportunity division, as well as other more useful departments. Surely some money from these bureaucratic divisions could be found to finance this actual useful research.