Click for original image.
Using decades of data and more advanced computer software, scientists have now compiled the most detailed map of the land and shorelines hidden below Antarctica’s massive icecap.
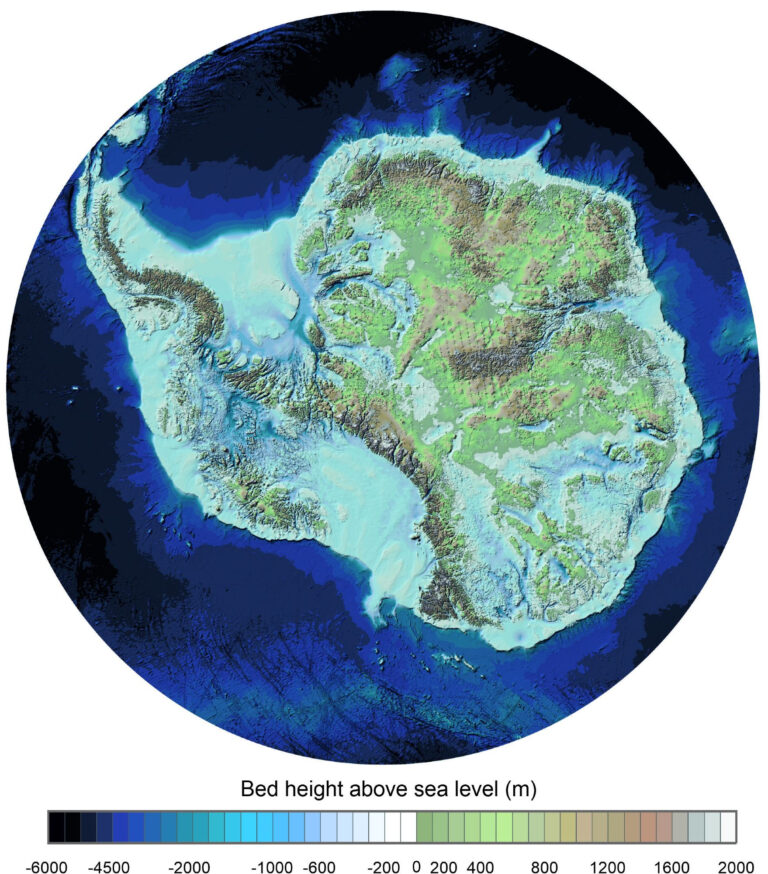
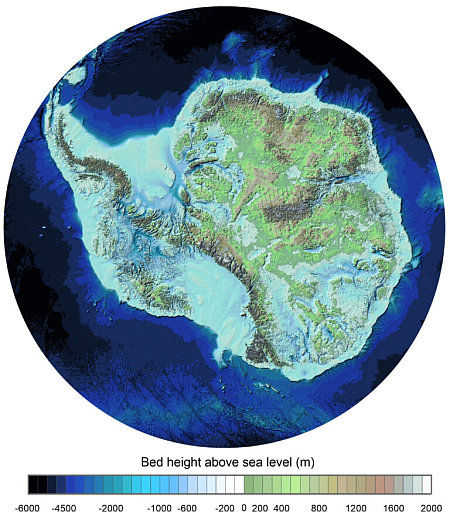
The map to the right, reduced to post here, shows that bedrock terrain generally in hues of green to brown, with lower elevations comparable to the ocean in hues of blue. The actual shoreline is however impossible to determine, since without the pressure of the icecap on top, the continent would rise, while the ocean itself would also rise with the addition of all that water.
You can read the science paper here.. From the press release:
Known as Bedmap3, it incorporates more than six decades of survey data acquired by planes, satellites, ships and even dog-drawn sleds. … The map gives us a clear view of the white continent as if its 27 million cubic km of ice have been removed, revealing the hidden locations of the tallest mountains and the deepest canyons.
One notable revision to the map is the place understood to have the thickest overlying ice. Earlier surveys put this in the Astrolabe Basin, in Adélie Land. However, data reinterpretation reveals it is in an unnamed canyon at 76.052°S, 118.378°E in Wilkes Land. The ice here is 4,757 m thick, or more than 15 times the height of the Shard, the UK’s tallest skyscraper.
The paper describes at length the large uncertainties that exist in this data. As thorough as they tried to be, we must remember that Antarctica is very large with a very hostile environment. Much of it has never been visited by any humans. Getting an accurate picture of the thickness of the ice at all points is presently impossible. This is basically an excellent summary of our best guess.