European sea-level satellite releases first data
Click for original.
The European Space Agency’s (ESA) Sentinel 6B satellite, launched a month ago, has now released its first sea-level data.
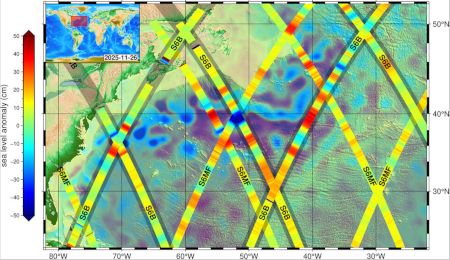
Following its launch on 17 November 2025, the first data from Sentinel-6B was captured on 26 November by the satellite’s Poseidon-4 altimeter. The image [to the right] is a combination of altimeter data from both the Sentinel-6 sea-level tracking satellites: Sentinel-6B and its twin, Sentinel-6 Michael Freilich, which was launched in 2020. The image shows the Gulf Stream current in the North Atlantic Ocean, off the eastern coasts of the US and Canada.
The Gulf Stream is a hugely important area of the North Atlantic Ocean, not only for the role it plays in global weather patterns and climate, but also because it’s a busy shipping route as well as a key ecosystem for marine species and therefore an important fishing zone.
What makes this particular government press release unusual is that though it is about a climate-related satellite, it makes no mention of global warming and how the sea level rise that has been recorded by the string of similar orbital satellites going back to 1993 is going to eventually drown us all. Maybe that’s because that total rise measured since 1993 equals only about 4 inches. That’s 4 inches of rise detected in more than three decades. At that rate, a little over an inch per decade, it will take centuries to drown anyone, but only those who refuse to walk a few feet to higher ground.
It could be the scientists and government PR hacks that are involved in writing this release also realized that the gig is up, and everyone now knows it, and it would only embarrass them further to push the global-warming hoax again.

Click for original.
The European Space Agency’s (ESA) Sentinel 6B satellite, launched a month ago, has now released its first sea-level data.
Following its launch on 17 November 2025, the first data from Sentinel-6B was captured on 26 November by the satellite’s Poseidon-4 altimeter. The image [to the right] is a combination of altimeter data from both the Sentinel-6 sea-level tracking satellites: Sentinel-6B and its twin, Sentinel-6 Michael Freilich, which was launched in 2020. The image shows the Gulf Stream current in the North Atlantic Ocean, off the eastern coasts of the US and Canada.
The Gulf Stream is a hugely important area of the North Atlantic Ocean, not only for the role it plays in global weather patterns and climate, but also because it’s a busy shipping route as well as a key ecosystem for marine species and therefore an important fishing zone.
What makes this particular government press release unusual is that though it is about a climate-related satellite, it makes no mention of global warming and how the sea level rise that has been recorded by the string of similar orbital satellites going back to 1993 is going to eventually drown us all. Maybe that’s because that total rise measured since 1993 equals only about 4 inches. That’s 4 inches of rise detected in more than three decades. At that rate, a little over an inch per decade, it will take centuries to drown anyone, but only those who refuse to walk a few feet to higher ground.
It could be the scientists and government PR hacks that are involved in writing this release also realized that the gig is up, and everyone now knows it, and it would only embarrass them further to push the global-warming hoax again.