
The sunspot crash continues
On Sunday NOAA posted its monthly update of the solar cycle, covering sunspot activity for December. As I do every month, I am posting it here with annotations to give it context.
The graph above has been modified to show the predictions of the solar science community. The green curves show the community’s two original predictions from April 2007, with half the scientists predicting a very strong maximum and half predicting a weak one. The red curve is their revised May 2009 prediction.
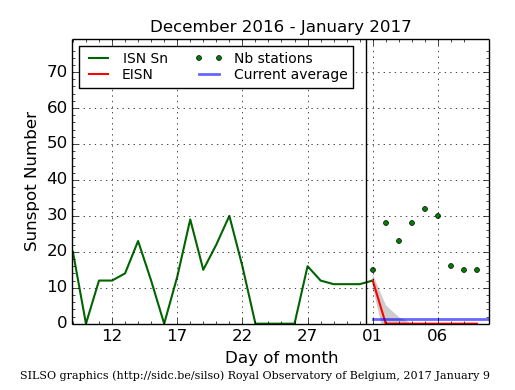
Sunspot activity continues to decline, and it appears to be declining at a steadily faster rate as the solar cycle ramps down towards minimum. Not only did sunspot activity drop below the 2007 low prediction in 2016, since 2017 began the sun has been blank almost continuously, as shown by the graph on the right. The signs continue to point to a solar minimum occurring much sooner than predicted, producing an unprecedented short and weak solar cycle.
Despite this, the appearance in December of the first sunspot for the next solar cycle suggests that we will not be entering a Grand Minimum in the coming decades. It does not guarantee it, as there is some evidence that even though no sunspots were visible during the Maunder Minimum in the 1600s the magnetic activity that causes sunspots did continue, and with our better observation equipment today we may see sunspots they would not have seen in the 1600s.


