
The sun influences the climate, admit the powers-that-be
Will wonders never cease? The sun actually does influence the climate, the powers-that-be admit at last.
Will wonders never cease? The sun actually does influence the climate, the powers-that-be admit at last.
Pressure seems to be mounting for Rajendra Pachauri to resign as head of the IPCC. Key quote:
“It’s vital that this body is led by someone whose academic and intellectual credentials are unquestioned and I’m afraid that can no longer be said of him.”
Rather than address the many questions people have about climate research (questionable research, unclear data, corrupt scientists), the White House has come up with a much better approach: Change the name of “global warming” to “global climate disruption.” Now, doesn’t that explain everything?
It appears that the Arctic icecap has reached its 2010 minimum. Though the icecap extent in the spring was the largest since 2002 (see image below), the melt was fast and the minimum appears to be the third lowest since 1979.
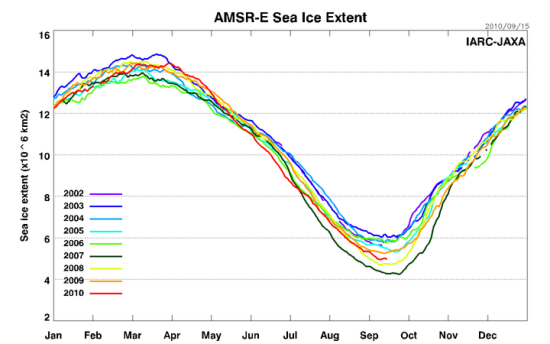
Does this mean the icecap is melting and will disappear shortly, as some politicians like to believe? Hardly. Though the data suggests a long term decline in ice extent, recent trends also show evidence that the icecap might be recovering. What will actually happen is still anyone’s guess.
Back to the climate-theory drawing board: A paper published today in Nature Geoscience suggests that the ocean conveyor belt that brings warm water to the northern Atlantic is far more complex than the original theories proposed. These results strengthen earlier reports that also questioned the conveyor belt theory.
The uncertainty of science: The melt rate of the icecaps is half what was previously calculated.
Meltdown of the climate ‘consensus’. Key quote:
What does the best evidence now tell us? That man-made global warming is a mere hypothesis that has been inflated by both exaggeration and downright malfeasance, fueled by the awarding of fat grants and salaries to any scientist who’ll produce the “right” results. The warming “scientific” community, the Climategate emails reveal, is a tight clique of like-minded scientists and bureaucrats who give each other jobs, publish each other’s papers — and conspire to shut out any point of view that threatens to derail their gravy train.
Better late than never. An independent academic panel has concluded that the IPCC needs reform.
Scientists have confirmed that the just ending low solar minimum had considerable influence in shrinking the Earth’s outer atmosphere. Key quote:
[The scientist] says the research indicates that the Sun could be going through a period of relatively low activity, similar to periods in the early 19th and 20th centuries. This could mean that solar output may remain at a low level for the near future. “If it is indeed similar to certain patterns in the past, then we expect to have low solar cycles for the next 10 to 30 years.”
Why bother with research when all we need to do is ask our politicians? Scientist Hillary Clinton studies the floods in Pakistan and the forest fires in Russia and declares them both proof that global warming is happening!
A new research paper, written by statistical scientists and to be published next month in the Annals of Applied Statistics, has found that Michael Mann’s hockey stick graph, showing a steep increase in global temperature in the last two hundred years, is statistically invalid. Key quote:
Research on multi-proxy temperature reconstructions of the earth’s temperature is now entering its second decade. While the literature is large, there has been very little collaboration with university level, professional statisticians (Wegman et al., 2006; Wegman, 2006). Our paper is an effort to apply some modern statistical methods to these problems. While our results agree with the climate scientists findings in some respects, our methods of estimating model uncertainty and accuracy are in sharp disagreement.
[We] conclude unequivocally that the evidence for a ”long-handled” hockey stick (where the shaft of the hockey stick extends to the year 1000 AD) is lacking in the data. The fundamental problem is that there is a limited amount of proxy data which dates back to 1000 AD; what is available is weakly predictive of global annual temperature. Our backcasting methods, which track quite closely the methods applied most recently in Mann (2008) to the same data, are unable to catch the sharp run up in temperatures recorded in the 1990s, even in-sample. [emphasis mine]
In other words, the temperature data going back to 1000 AD is poor, and cannot be reliably used to prove a sudden increase in global temperature in the last two hundred years. More importantly, according to this paper, Michael Mann tried to use statistics to prove his point, without consulting any statisticians.