
Hiking into the solar system’s biggest canyon

Click for original image.
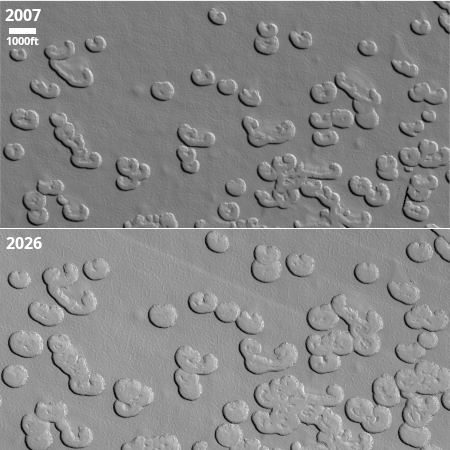
Cool image time! The picture to the right, cropped, reduced, and sharpened to post here, was taken on June 3, 2026 by the high resolution camera on Mars Reconnaissance Orbiter (MRO).
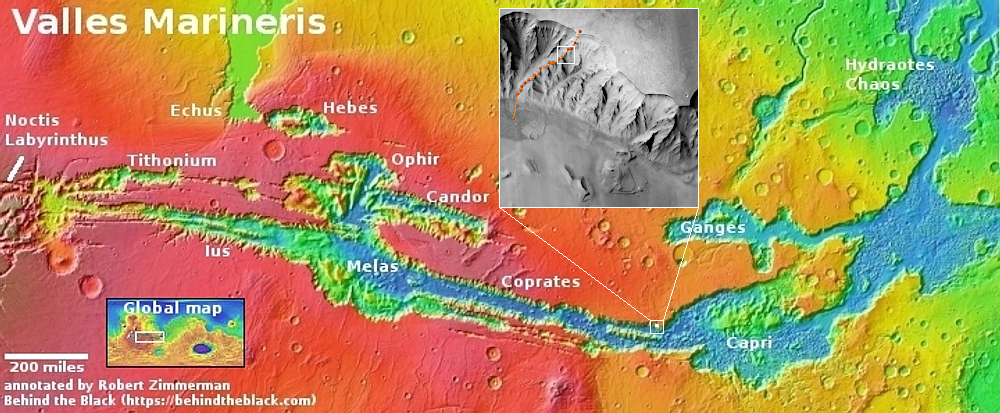
The white dot on the overview map shows the location, on the northern interior wall of Valles Marineris, the largest canyon in the solar system. The scientists took this image to get a good look at those canyon walls. I am highlighting the image because it provides a good way to illustrate the monumental scale of this vast canyon.
The inset on the overview map includes an orange dotted line, following the likely route for a trail along the nose of this ridge, going from the rim to the canyon floor. The picture to the right shows only one small section of that ridge trail, near the top. And yet, from the upper left to the lower right of the photograph a hike along that ridgeline would cover 2.2 miles and descend about 4,500 feet, a descent somewhat comparable to hiking into the Grand Canyon though dropping much more steeply. On either side of you the slopes would drop off from 1,600 to 2,000 feet.
To hike from the top of the rim to the canyon floor however would be far more challenging and be even more spectacular. The length of that orange dotted line is about 17.3 miles, with the total elevation drop about 23,000 feet — 3,000 feet greater than climbing the highest mountain in the U.S., Mount McKinley in Alaska.
Think about it. Along this part of Valles Marineris the elevation difference between the canyon floor and the rim is routinely much greater than the height of America’s tallest mountain. Every hike down into that canyon along the north wall would present a similar challenge. And from this point that northern canyon wall extends more than 650 miles westward and about 250 miles eastward. That’s a lot of Mount McKinley’s lined up in a row!
With these scales, it is at present difficult to imagine what the view from that rim would be like. You would see farther and deeper than most places on Earth, on a planet with a far thinner but more dusty atmosphere.


.jpg)