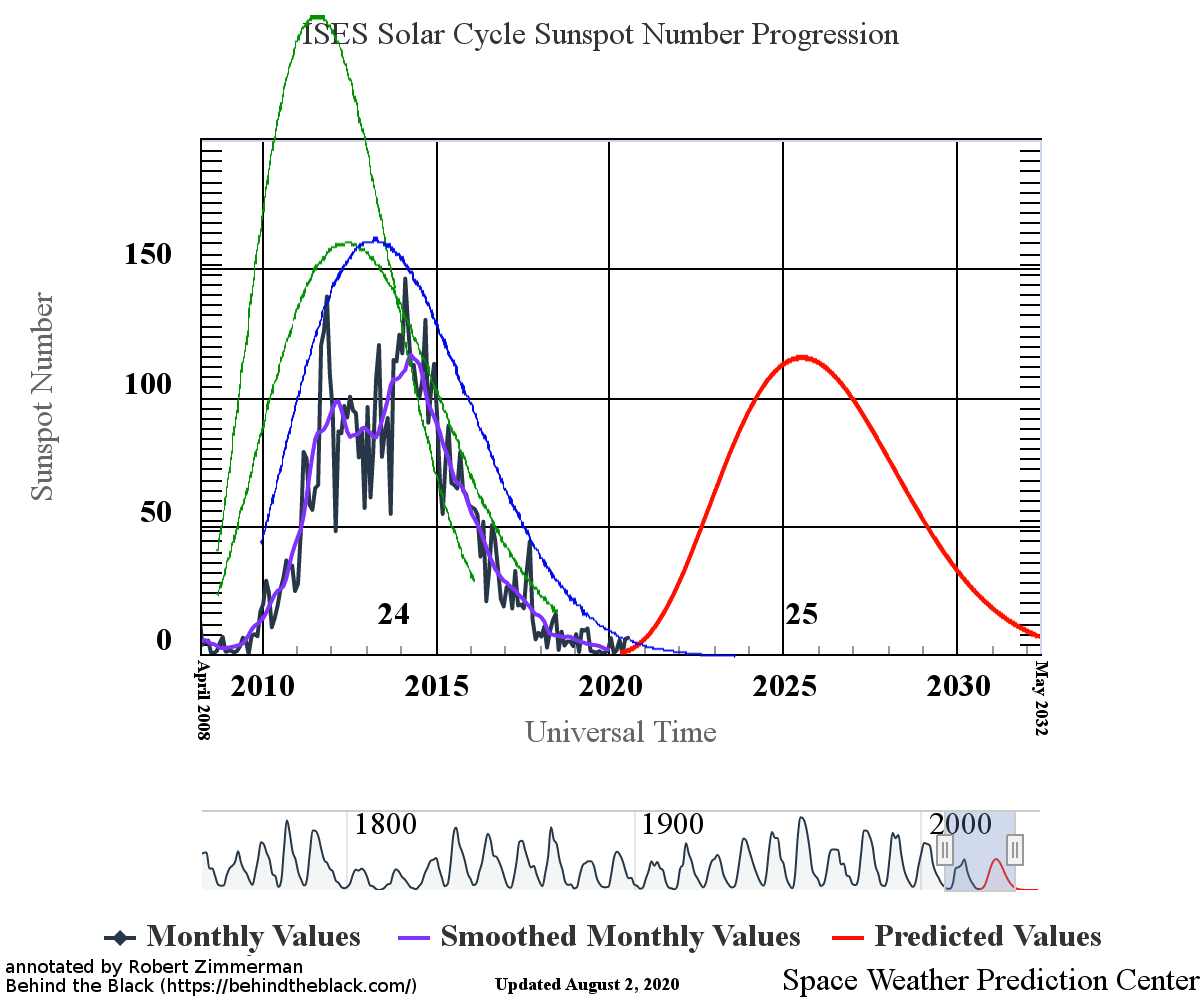
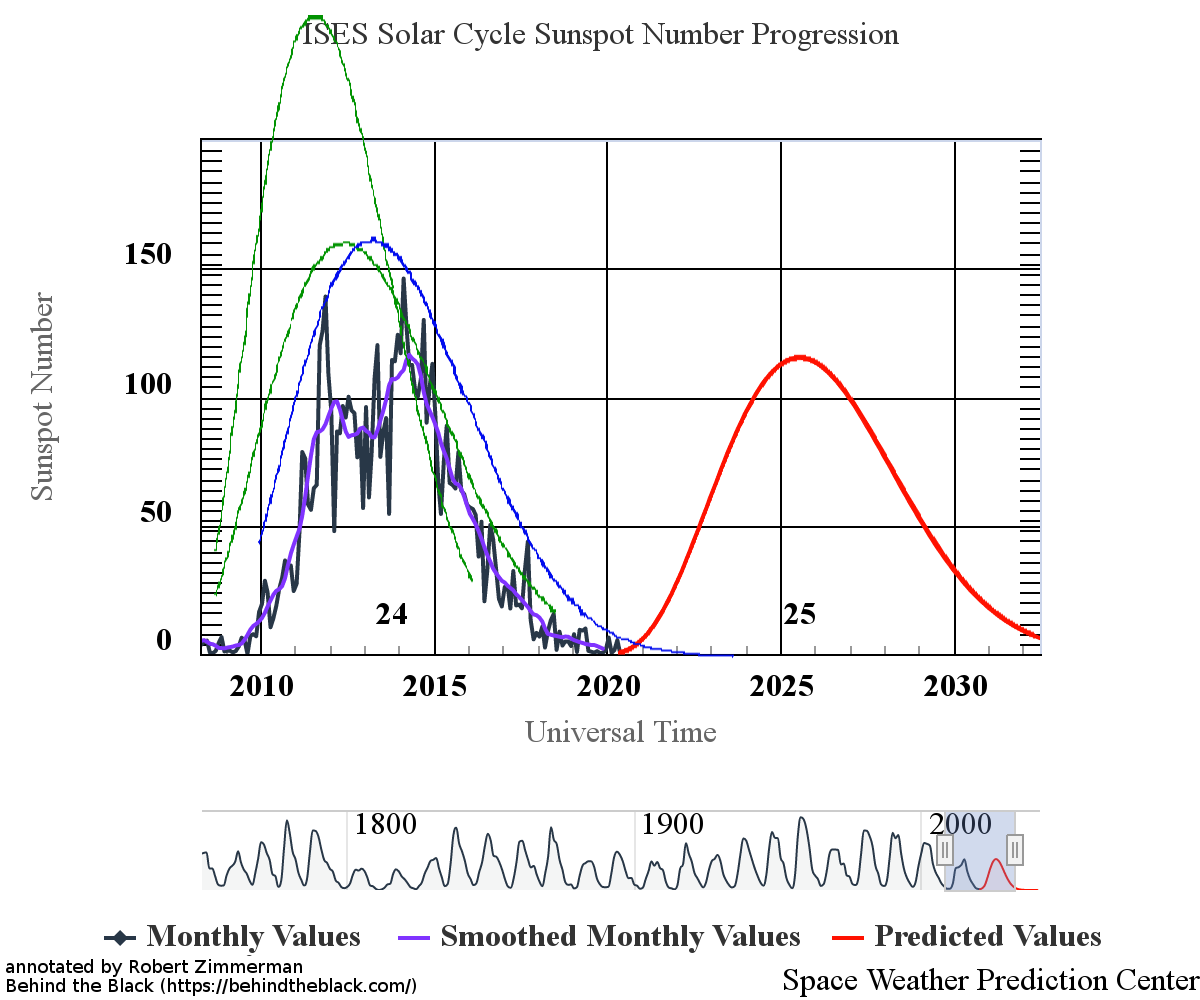
Last week NOAA updated its graph for tracking the monthly activity of sunspots on the Sun’s visible hemisphere. Below is that updated graph, annotated by me to show the past and new solar cycle predictions.
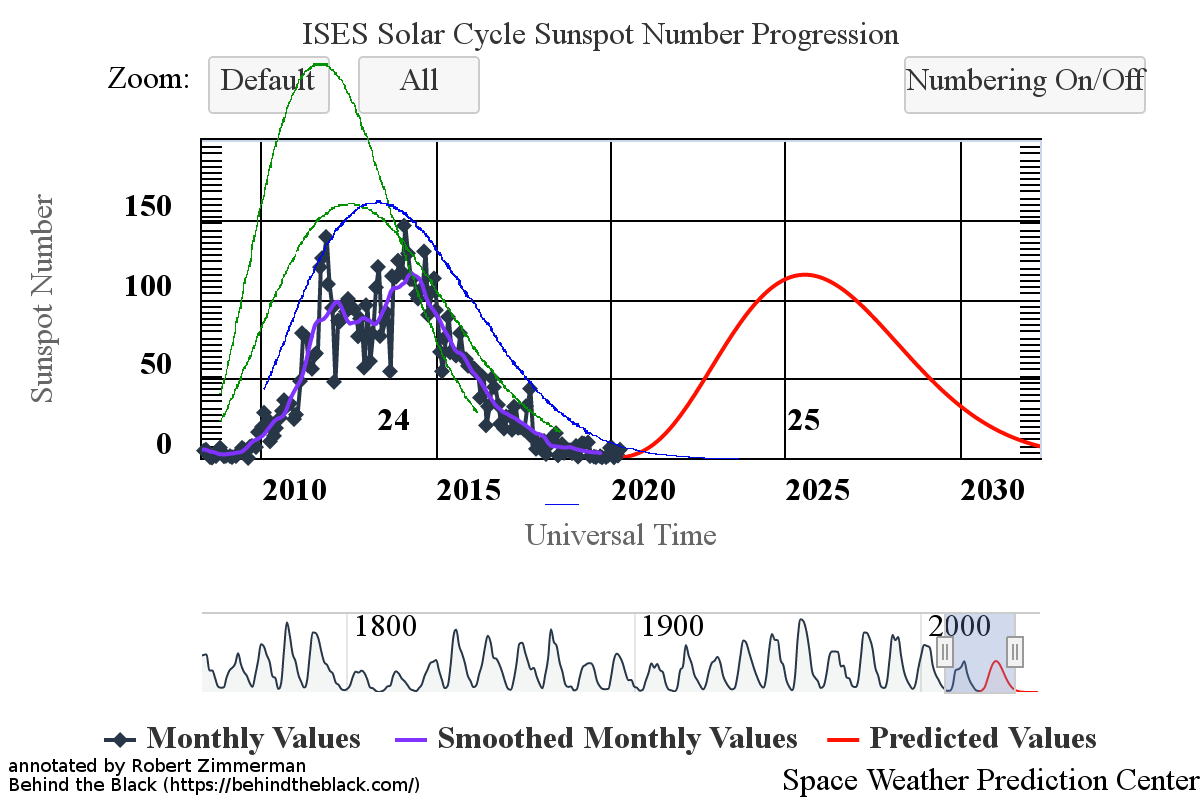
The graph above has been modified to show the predictions of the solar science community for both the previous and upcoming solar maximums. The green curves show the community’s two original predictions from April 2007 for the previous maximum, with half the scientists predicting a very strong maximum and half predicting a weak one. The blue curve is their revised May 2009 prediction. The red curve is the new prediction, first posted by NOAA in April 2020.
Because of the design of this graph, revamped by NOAA in April, it is difficult at this scale — which for context shows both the past cycle and the predicted future cycle — to see the addition of the April sunspot total, when compared to last month’s graph. Trust me, it is there. In April sunspot activity went up, but trivially so, with only four sunspots during the month, three of which had a magnetic polarity assigning them to the next solar maximum.
The solar minimum remains very deep, deeper than the very deep previous minimum, and possibly the least active in two hundred years. The presence however of more sunspots for the new cycle strengthens the expectation that we will not be entering a grand minimum, with no sunspots for decades. It just appears that, as predicted, the next solar maximum will be a very weak one.
How this weak activity will effect the climate remains an unknown. In the past, such as the weak maximum that just ended as well as during past weak maximums at the beginning of the 1800s and the 1900s, the Earth’s climate cooled. It also cooled during the Little Ice Age in the 1600s, during the last grand minimum.
Whether the same will happen in the next decade remains unknown. Global warming activists will claim impossible, we are all going to die from overheating. The data for the past decade proves them wrong, though in the coming years they might be vindicated.
All we can do is wait, pay attention to the data, and make our conclusions from that.