Sunspot update for February 2017
On Sunday NOAA posted its monthly update of the solar cycle, covering sunspot activity for February. As I have been doing every month since 2010, I am posting it here with annotations to give it context.
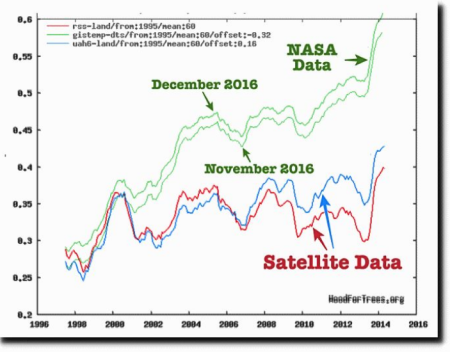
The graph above has been modified to show the predictions of the solar science community. The green curves show the community’s two original predictions from April 2007, with half the scientists predicting a very strong maximum and half predicting a weak one. The red curve is their revised May 2009 prediction.
The decline in sunspots continues. Though the increase in activity from January held in February, the overall activity remains significantly below the predictions, and continues to point to a much earlier arrival of the solar minimum, sometime in 2019.
On Sunday NOAA posted its monthly update of the solar cycle, covering sunspot activity for February. As I have been doing every month since 2010, I am posting it here with annotations to give it context.
The graph above has been modified to show the predictions of the solar science community. The green curves show the community’s two original predictions from April 2007, with half the scientists predicting a very strong maximum and half predicting a weak one. The red curve is their revised May 2009 prediction.
The decline in sunspots continues. Though the increase in activity from January held in February, the overall activity remains significantly below the predictions, and continues to point to a much earlier arrival of the solar minimum, sometime in 2019.