
The news coming from the Perseverance and Ingeniuty science teams has been sparse this past weekend, even though Perseverance had begun drilling its first core sample that it will stored for pickup by a later unmanned robot, and Ingenuity had attempted its 10th and most challenging flight yet.
We do have images however, and the two to the right give us hints about what has happened.
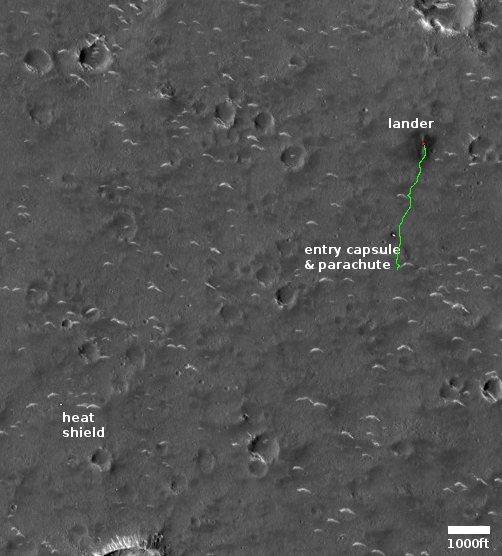
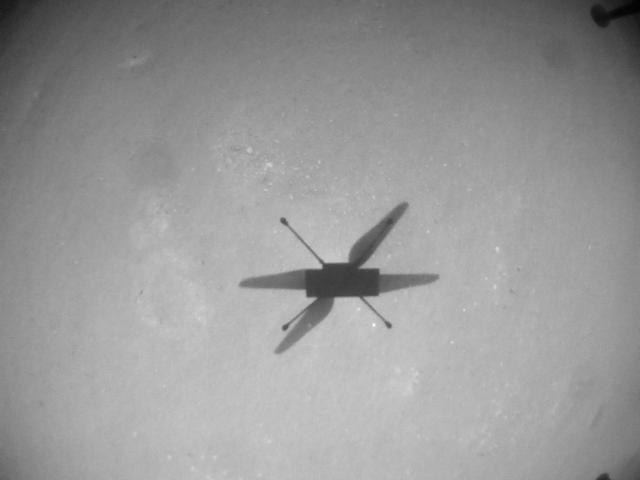
First, the top picture on the right was taken by Ingenuity’s navigation camera just prior to landing. The camera looks straight down and is used by the helicopter to adjust its flight. The dark area is the helicopter’s shadow. Based on this picture and the four preceding images (taken over an eleven second period), it appears the helicopter was landing safely. No other images have yet been downloaded, nor has the Ingenuity team announced any results, so we do not yet know if the flight proceeded as planned.
UPDATE: The flight was a success, as per this JPL announcement:
With the #MarsHelicopter’s #flight success today, we crossed its 1-mile total distance flown to date. It targeted an area called “Raised Ridges,” named for its #geographic features. Flight 10 is #Ingenuity’s most complex flight profile yet, with 10 distinct waypoints and a new #record height of 40 feet (12 meters).
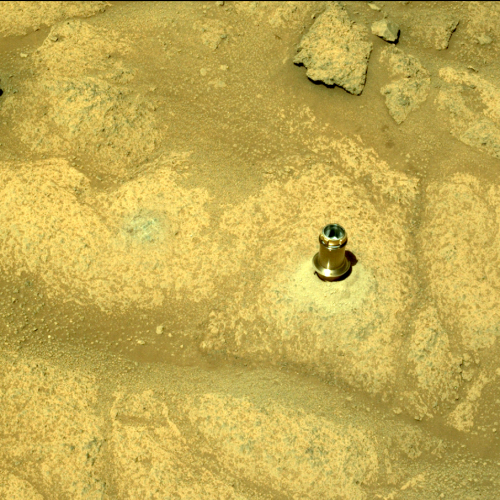
The second image, taken by Perseverance’s left navigation camera and cropped and reduced to post here, is more puzzling. It shows what appears to be the core sample still in the ground after drilling. While this could be entirely as planned, it seems very surprising. Most of what I can find online describing the operation for obtaining these samples implies that the robot arm would drill the hole, and then retract the sample immediately to place it in storage. Nothing suggests the arm would be retracted with the sample still in the ground.
I think however the odds of this picture revealing a problem are low. This JPL press release from February 2021 implies vaguely that the core sample will be released in this manner before retraction. After the core sample, with bit, is separated from the arm, the release suggests they will lift the arm away to inspect the drilling process, then return the arm to retract the core sample for storage. This does make some sense, though grabbing that sample again will be quite challenging.
If this was not supposed to happen as described, then there is a problem that must be resolved. I expect more details in the next day or so to clarify this situation.


