Sunspot update for June 2017

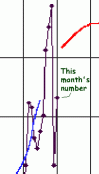
Today NOAA posted its monthly update of the solar cycle, covering sunspot activity for June. As I have done every month since 2010, the graph is posted below, with annotations.

June 2017 Solar Cycle graph

The graph above has been modified to show the predictions of the solar science community. The green curves show the community’s two original predictions from April 2007, with half the scientists predicting a very strong maximum and half predicting a weak one. The red curve is their revised May 2009 prediction.

Sunspot activity in June was almost exactly the same as in May, and thus continued the overall downward trend that is below the 2007 low prediction and that suggests that this very weak solar maximum will end much earlier than predicted, and will make it an unprecedented short but weak cycle. The Sun is once again blank today for the first time in about two weeks, repeating the pattern we have seen for several months where, because one hemisphere of the Sun is blank while the other hemisphere has some sunspots, the rise and fall of the sunspot counts tracks the 27-day solar rotation almost precisely.

There continues to be evidence that the Sun is undergoing significant changes this solar cycle, all of which are pointing to the possibility that a grand minimum is coming, with no sunspots for decades. And as I have said now monthly for six years, past grand minimums have consistently occurred at the same time the Earth’s climate has cooled. The scientific link remains unclear, but if we should undergo a grand minimum in the coming decades, we will finally have the opportunity to find out what that link is.

7 comments

Sunspot update for May 2017

Last week NOAA posted its monthly update of the solar cycle, covering sunspot activity for May. Unfortunately, there appeared to be a problem with their posting software. Though the date of the image changed, the graph itself was not updated. I contacted NOAA, and Ann Newman, IT Specialist at NOAA’s
Space Weather Prediction Center, took a look and quickly fixed the problem.

The corrected graph is posted below, with annotations, as I have done now every month since 2010.

May 2017 Solar Cycle graph

The graph above has been modified to show the predictions of the solar science community. The green curves show the community’s two original predictions from April 2007, with half the scientists predicting a very strong maximum and half predicting a weak one. The red curve is their revised May 2009 prediction.

The decline in sunspot activity resumed in May, putting the trend back below the 2007 low prediction. Overall, the trend continues to suggest that this very weak solar maximum will end much earlier than predicted, and will make it an unprecedented short but weak cycle. As the Sun is at this moment blank, and has been for several days, I expect that June will end up with low numbers as well, continuing this trend.

As I have repeatedly said now monthly for six years, if history is any guide, the Sun’s low activity should correspond with cooler temperatures here on Earth. Why this happens is not yet understood, though there are theories.

3 comments

NASA names next solar mission after pioneer solar scientist Eugene Parker

NASA has named its next solar mission, which will fly closer to the Sun than any previous mission, after pioneer solar scientist Eugene Parker, who in the 1950s predicted the existence of the solar wind.

The new moniker honors pioneering University of Chicago astrophysicist Eugene Parker, who predicted the existence of the solar wind β€” the stream of charged particles flowing constantly from the sun β€” back in 1958. [Solar Quiz: How Well Do You Know Our Sun?]

NASA has named about 20 space missions after people; the Hubble Space Telescope is perhaps the most famous example. But the 89-year-old Parker is the first researcher to be celebrated in this manner while still alive, agency officials said.

Parker deserves it, for sure, and it is really nice to honor him while he is still alive to appreciate it.

The spacecraft is scheduled to launch at the end of July.

7 comments

Sunspot update for April 2017

Today NOAA posted its monthly update of the solar cycle, covering sunspot activity for April. It is posted below, with annotations, as I have done now every month since 2010.

April 2017 Solar Cycle graph

The graph above has been modified to show the predictions of the solar science community. The green curves show the community’s two original predictions from April 2007, with half the scientists predicting a very strong maximum and half predicting a weak one. The red curve is their revised May 2009 prediction.

April showed an uptick in sunspot activity, enough to move the numbers back up above the 2007 low prediction. Nonetheless, activity as the cycle has been ramping down has consistently and generally remained below expectation, and does seem heading to an early arrival of solar minimum, sometime in late 2019 or early 2020, about a year early.

I don’t want to sound like a broken record, as I have written this practically every month since I started these updates in 2010, but this short and weak solar maximum suggests the possibility that we might be facing a grand minimum, where there are no significant sunspots for decades. Some solar scientists think this is coming. Others are much more doubtful. Regardless, we can only wait and watch, while also recognizing that weak solar maximums and grand minimums have in the past consistently coincided with global cool weather. The reasons why this has happened are not yet known, but it has happened nonetheless.

1 comment

Sunspot update for March 2017

On April 3, while I was in the Grand Canyon, NOAA posted its monthly update of the solar cycle, covering sunspot activity for March. As I have been doing every month since 2010, I am posting it here with annotations to give it context.

March 2017 Solar Cycle graph

The graph above has been modified to show the predictions of the solar science community. The green curves show the community’s two original predictions from April 2007, with half the scientists predicting a very strong maximum and half predicting a weak one. The red curve is their revised May 2009 prediction.

The decline in sunspots continues to run below predictions, suggesting an end to this solar cycle and a solar minimum as early as sometime in 2018. And as I noted in my February update, sunspot activity continues to track the Sun’s 27 day rotation, alternating every two weeks between blank and active hemispheres. We had the longest stretch, more than two weeks, without sunspots in March. This was followed by about two weeks of activity, followed by several blank days and a relatively inactive Sun at present, beginning a little less than a week ago. I expect this period of inactivity to last another ten days or so, and then things will pick up again.

2 comments

The longest stretch of no sunspots since 2009

The Sun just completed its longest stretch, 15 days, without sunspots since 2009, suggesting once again that the solar minimum is coming much sooner than expected.

So far this year the Sun has been blank 34% of the time, a pace that makes this year almost as blank as 2009, the year in which the previous solar minimum ended. This suggests that 2017 might be the year in which the next solar minimum begins, which would be about two years earlier than the earliest predictions.

The more likely scenario is that 2018 will be the year the solar minimum begins, with 2019 when solar activity bottoms out. This will still be much earlier than expected, making this solar cycle only about 9-10 years long. What makes this more significant is that historically short cycles always went with high activity, while long cycles signaled an inactive and weak maximum. This cycle will be the first that is both short and weak.

What happens next remains the big question. Will the Sun enter a grand minimum, with no sunspots for decades? Or will sunspot activity continue? Since solar scientists really do not yet understand the mechanism within the sun’s magnetic field that causes this solar cycle, we really can’t answer these questions, in advance. We must wait, and see.

3 comments

Sunspot update for February 2017

On Sunday NOAA posted its monthly update of the solar cycle, covering sunspot activity for February. As I have been doing every month since 2010, I am posting it here with annotations to give it context.

February 2017 Solar Cycle graph

The graph above has been modified to show the predictions of the solar science community. The green curves show the community’s two original predictions from April 2007, with half the scientists predicting a very strong maximum and half predicting a weak one. The red curve is their revised May 2009 prediction.

The decline in sunspots continues. Though the increase in activity from January held in February, the overall activity remains significantly below the predictions, and continues to point to a much earlier arrival of the solar minimum, sometime in 2019.

0 comments

The Sun turns

NOAA today posted its monthly update of the solar cycle, covering sunspot activity for January. As I do every month, I am posting it here with annotations to give it context.

January 2017 Solar Cycle graph

The graph above has been modified to show the predictions of the solar science community. The green curves show the community’s two original predictions from April 2007, with half the scientists predicting a very strong maximum and half predicting a weak one. The red curve is their revised May 2009 prediction.

Since my last solar cycle update, sunspot activity showed a slight increase in activity when compared to the previous month. Overall, however, the ramp down from solar maximum continues to underperform the predictions, and suggests that this solar maximum will not only be a very weak one, but a short one as well.

January’s activity however illustrated a statistical phenomenon that is typical of the sunspot count. That count is determined not by the numbers of sunspots on the entire surface of the Sun, but on the sunspots visible on the side of the Sun facing the Earth. Since it is not unusual for one face to be more active than the other, as we transition from maximum to minimum the sunspot counts will often show a more pronounced up-and-down curve reflecting this fact. Since the Sun’s day equals about 27 Earth days, this means that about every two weeks the active side will dominate our view until it rotates away and the inactive side reveals itself for two weeks.

Silso daily sunspot graph, January to February 2017

This pattern was very evident in January, as shown by the graph on the right and obtained from here. During the first two weeks of the month the Sun was blank. Then that inactive face rotated out of view. For the next two weeks or so the sunspot count went up, then began to drop as the active face began to rotate out of view to be replaced by the blank face last seen in early January.

This pattern of course is very fluid, as at any time the inactive face can become more active and the active face less so. Nonetheless, for short periods covering one to three months it helps to partly explain the up-and-down pattern of sunspot fluctuations during this time period when large portions of the Sun’s face are blank.

7 comments

The sunspot crash continues

On Sunday NOAA posted its monthly update of the solar cycle, covering sunspot activity for December. As I do every month, I am posting it here with annotations to give it context.

December 2016 Solar Cycle graph

January 2017 sunspots as of January 9, 2017

The graph above has been modified to show the predictions of the solar science community. The green curves show the community’s two original predictions from April 2007, with half the scientists predicting a very strong maximum and half predicting a weak one. The red curve is their revised May 2009 prediction.

Sunspot activity continues to decline, and it appears to be declining at a steadily faster rate as the solar cycle ramps down towards minimum. Not only did sunspot activity drop below the 2007 low prediction in 2016, since 2017 began the sun has been blank almost continuously, as shown by the graph on the right. The signs continue to point to a solar minimum occurring much sooner than predicted, producing an unprecedented short and weak solar cycle.

Despite this, the appearance in December of the first sunspot for the next solar cycle suggests that we will not be entering a Grand Minimum in the coming decades. It does not guarantee it, as there is some evidence that even though no sunspots were visible during the Maunder Minimum in the 1600s the magnetic activity that causes sunspots did continue, and with our better observation equipment today we may see sunspots they would not have seen in the 1600s.

2 comments

First sunspot for the next solar cycle spotted

Solar scientists have spotted the first sunspot on the Sun with a reversed polarity, meaning that it really belongs to the next sunspot cycle.

This is not unusual. The sunspots from different cycles routinely overlap by several years, with the sunspots from the old cycle moving close to the equator with time and the new cycle sunspots appearing at high latitudes. What this does suggest is that there will be sunspots after the upcoming solar minimum, rather than the beginning of a new Grand Minimum with no sunspots for decades.

0 comments

Sunspot activity continues to drop

NOAA yesterday posted its monthly update of the solar cycle, covering sunspot activity for November. Below is my monthly annotated version of that update.

November 2016 Solar Cycle graph

The graph above has been modified to show the predictions of the solar science community. The green curves show the community’s two original predictions from April 2007, with half the scientists predicting a very strong maximum and half predicting a weak one. The red curve is their revised May 2009 prediction.

In November sunspot activity dropped again, to the second lowest point seen since 2010. Essentially, activity today is about where it was in 2010 when the solar minimum was finally ending. Now, the solar maximum is ending and we are beginning the next solar minimum.

Throughout the entire just completed solar maximum, the Sun continuously under-performed all predictions. Even now, despite following almost precisely the prediction of the 2007 low prediction during 2014 and 2015, in 2016 the ramp down has begun to slip below that prediction. The trend continues to suggest the arrival of solar minimum will be early, possibly as early as sometime late next year.

2 comments

Sunspot ramp down resumes

On Monday NOAA posted its monthly update of the solar cycle. I am posting it here, as I do every month, with annotations to give it context.

September 2016 Solar Cycle graph

The graph above has been modified to show the predictions of the solar science community. The green curves show the community’s two original predictions from April 2007, with half the scientists predicting a very strong maximum and half predicting a weak one. The red curve is their revised May 2009 prediction.

After two months of increased sunspot activity, the decline in sunspots resumed in September, though activity did not drop significantly. Overall though, the ramp down towards the next solar minimum continues to track quite closely the ramp down predicted by weak prediction made by half the solar science community back in 2007 (the lower green curve above). These scientists however do not have much to brag about. Their same prediction completely missed the ramp up, which happened a year later than predicted, as well as the activity peak, which was far weaker than predicted.

In fact, the ramp down now continues to point to the possibility that this very weak solar cycle will also be a very short one, something that is quite unprecedented, and suggests that we might be seeing the lead in to another Grand Minimum, where there are no sunspots for decades. Since no one understands yet exactly why such grand minimums happen, however, this remains pure speculation. We will only find out by watching what happens, as it happens.

3 comments
1 13 14 15 16 17 32