The Sun settling down?

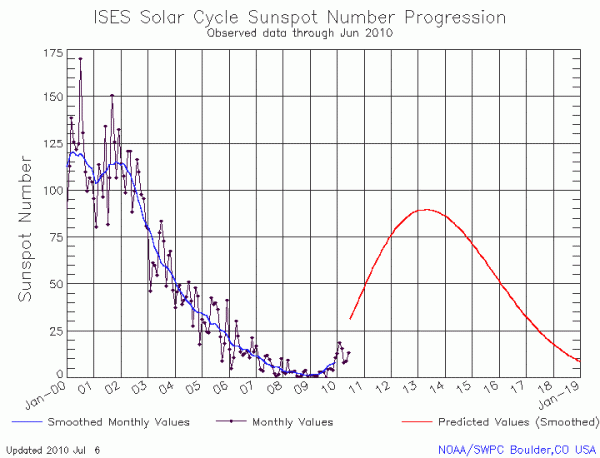
Two weeks ago NOAA posted its monthly update of the solar cycle, showing the sunspot activity for the Sun in April. I have been remiss about doing my monthly post about this, so here it is now, posted below with annotations.

April Solar Cycle graph

The graph above has been modified to show the predictions of the solar science community. The green curves show the community’s two original predictions from April 2007, with half the scientists predicting a very strong maximum and half predicting a weak one. The red curve is their revised May 2009 prediction.

The Sun continued the drop in sunspots seen the previous month, though the total number remains above the 2009 prediction for this moment in the solar cycle. As already noted, that the second peak of this double peaked solar maximum has been much stronger than the first remains unprecedented.

Overall, the maximum continues to be the weakest seen in a hundred years. Whether this is an indicator of future events or an anomaly can only be discovered after the Sun completes this solar solar cycle and begins the ramp up to its next solar maximum, at least five years away.

The next update is only a few weeks away. Stay tuned.

5 comments

The Sun continues to hiccup

It’s sunspot time again! On Monday NOAA posted its monthly update of the solar cycle, showing the sunspot activity for the Sun in February. I am once again posting it here, below the fold, with annotations.

Like it did in January, the Sun’s second peak of the solar maximum continued to beat its first peak, an unprecedented event. Though activity dropped slightly, it still remained above prediction and was only slightly below the first peak’s maximum. Overall, the second peak has been much stronger than the first, something that scientists have never seen before. In the past, when the Sun had a double peaked solar maximum, the second peak was always weaker. Not this time!
» Read more

1 comment

The Sun goes boom again!

On Monday NOAA posted its monthly update of the solar cycle, showing the sunspot activity for the Sun in January. As I do every month, I am posting it here, below the fold, with annotations.

January was the most active month for sunspots this entire solar cycle, exceeding the predictions of the solar scientists, an event that has been quite rare during this generally weak solar maximum. In fact, the Sun was so active that for the first time, the second peak in a double-peaked solar maximum exceeded the first peak in sunspot activity.
» Read more

3 comments

The uncertainty of knowledge

NOAA this week posted its monthly update of the solar cycle, showing the sunspot activity for the Sun in January. As I do every month, I am posting it here, below the fold, with annotations.

Back in October the Sun’s sunspot activity had plummeted, following almost two years of very weak activity. At that time, I wrote, “It appears the solar maximum has ended. The only question now is how long and deep the upcoming solar minimum will be.”

Well, talk about foolish predictions. I should shake hands with Al Gore and James Hansen for making the mistake of announcing the future as if I know what will happen. The truth is that no one truly understands the Sun’s sunspot cycle.

In January the Sun continued the high sunspot activity of the previous three months, once again producing sunspots in numbers close to the actual predictions of the solar science community. And while all their predictions remain generally high when compared to the actual numbers, they can now feel reassured that the overall length and strength of this solar maximum is beginning to resemble the prediction of the solar scientists who thought this would be a weak maximum.
» Read more

1 comment

Yippee! Solar scientists finally get it right

Earlier this week NOAA posted its monthly update of the solar cycle, showing the sunspot activity for the Sun in December. As I do every month, I am posting it here, below the fold, with annotations.

December was an active month for sunspots, so much so that for only the second time during this solar maximum has the Sun’s activity actually met and exceeded the predictions of the solar science community. In fact, the Sun’s high activity in both November and December has made this second peak in solar maximum almost as strong as the first peak in October 2011. Normally, the second peak of a double-peaked maximum is relatively weak. Not so this time.

» Read more

1 comment

The big solar hotshots of 2013.

The big solar hotshots of 2013.

The article is a nice and visually fascinating overview of the twelve most impressive solar events during the past year. Interestingly, I think #7 is the most significant in that it involved things that didn’t happen.

As small sunspot group NOAA 1838 was falling apart, another active region NOAA 1839 appeared just in time to avoid a spotless day, which would have been the first since 14 August 2011! A spotless day during a solar cycle maximum is not uncommon, but it remains of course a rare event. This absolute low in sunspot number highlighted a period of very low solar activity, with hardly any flares (no C-flares from 7 till 17 September: 11 consecutive days) and no (minor) geomagnetic storms for a full month! Meanwhile, the magnetic field near the solar north pole (finally) completed its reversal, whereas this magnetic flip is still ongoing at the south pole. These reversals testify we’re close to the maximum of solar cycle 24. [emphasis mine]

The phrases in bold clarify where we presently stand with the solar cycle. The southern magnetic field is in the process of reversing, but has not yet completed the flip.

1 comment

An upbeat wimpy maximum holds on

Today NOAA posted its monthly update of the solar cycle, showing the sunspot activity for the Sun in November. As I do every month, I am posting it here, below the fold, with annotations.

As in October, the Sun was more active than it has been for this entire solar maximum. November’s numbers dropped slightly from October, but still remained high, though as has been typical for this solar maximum they remained below prediction.
» Read more

1 comment

Using Solar Dynamics Observatory (SDO), scientists have finally identified the Sun’s predicted giant jet streams.

Using Solar Dynamics Observatory (SDO), scientists have finally identified the Sun’s predicted giant jet streams.

These large flows, bigger than any flow structures previously identified, might help explain the Sun’s rotation (which is faster at the equator than at the poles), its magnetic field, and its production of sunspots. Not surprisingly, however, the models and data do not match exactly:

Mark Miesch, a physicist at the National Center for Atmospheric Research in Boulder, Colorado, says the new study confirms modelling work he and others have done on giant convective cells4. There are, however, some differences between what the models suggest and what Hathawayโ€™s team observed. For instance, the models indicate that giant cells should align themselves from north to south near the Sun’s equator, an arrangement that isnโ€™t seen in the new data. In fact, points out solar physicist Junwei Zhao of Stanford University in California, most of the giant cells were seen at high latitudes, and they need to be spotted at lower latitudes as well. โ€œWhether it will convince the community remains to be seen,โ€ says Zhao.

0 comments

The sun goes boom!

It is always best to admit when you are wrong as soon as you find out. Last month, in reporting NOAA’s monthly update of the solar cycle, I unequivocally stated that

My interpretation of this data tells me that almost certainly the solar maximum has ended. We might see some later fluctuations whereby the sunspot number jumps, but the Sun is clearly beginning its ramp down to solar minimum.

Well, I spoke too soon. Last night NOAA posted the newest update of the solar cycle, and it shows that in October the Sun was more active then it has been in two years. In fact, for only the second time this entire solar cycle the Sun’s sunspot activity actually came close to matching the predictions of scientists. This month’s graph is posted below the fold, with annotations.
» Read more

2 comments

Sunrise tomorrow on the East Coast will be interesting, as the sun will rise in the middle of a partial solar eclipse.

Sunrise tomorrow on the East Coast will be interesting, as the sun will rise in the middle of a partial solar eclipse.

Technically speaking, the partial eclipse could be visible as far inland as, say, Tennessee. Sky & Telescope projects that 57 percent of the sun’s diameter could be covered over at sunrise in Boston, 48 percent in New York, 44 percent in Philadelphia, 35 percent in Washington, and 36 percent in Miami. But you’d have to have a clear view of a flat horizon โ€” and no matter where you are on the East Coast, the partial eclipse will be over within an hour after sunrise.

0 comments

Ramping down from solar maximum

Yesterday, despite the government shutdown, NOAA posted its monthly update of the solar cycle, and as I do every month, I am posting it here, below the fold, with annotations.

My interpretation of this data tells me that almost certainly the solar maximum has ended. We might see some later fluctuations whereby the sunspot number jumps, but the Sun is clearly beginning its ramp down to solar minimum.
» Read more

4 comments

“The face of the sun is nearly blank.”

Today NOAA posted its monthly update of the solar cycle, and as I do every month, I am posting it here, with annotations.

Before we take a look at that, however, there is other climate news that is apropos. The Daily Mail in the UK put out an entertaining article on Saturday with the headline “And now it’s global COOLING! Record return of Arctic ice cap as it grows by 60% in a year.”

The article is entertaining because, after illustrating the ice-cap’s recovery this year, it then notes the 2007 prediction by global warming climate scientists that the Arctic Ocean would be “ice-free” by 2013. If this isn’t a good example of the dangers of crying wolf, I don’t know what is.

I should emphasize that the ice-cap recovery this year does not prove that global warming has ceased. A look at this graph from satellite data shows that even though the Arctic icecap has recovered, it is still remains small when compared to the past few decades. The increase this year might only be a blip, or it could be indicating a new trend. We won’t really know for another five years, if then.

The article is also entertaining because it outlines the confusion that is right now going on behind the scenes at the IPCC. The next IPCC report is scheduled to come out next month, but no one agrees with its conclusions because it apparently ignores or minimizes the approximately fifteen year pause in warming that has now been documented since the late-1990s.

In its draft report, the IPCC says it is โ€˜95 per cent confidentโ€™ that global warming has been caused by humans โ€“ up from 90 per cent in 2007. This claim is already hotly disputed. US climate expert Professor Judith Curry said last night: โ€˜In fact, the uncertainty is getting bigger. Itโ€™s now clear the models are way too sensitive to carbon dioxide. I cannot see any basis for the IPCC increasing its confidence level.โ€™ [emphasis mine]

It appears that scientists and governments are demanding approximately 1500 changes to the IPCC draft, which suggests its release will be delayed significantly.

Meanwhile, the Sun continues its lackluster and weak solar maximum.
» Read more

2 comments
1 18 19 20 21 22 32