The sunspot decline continues

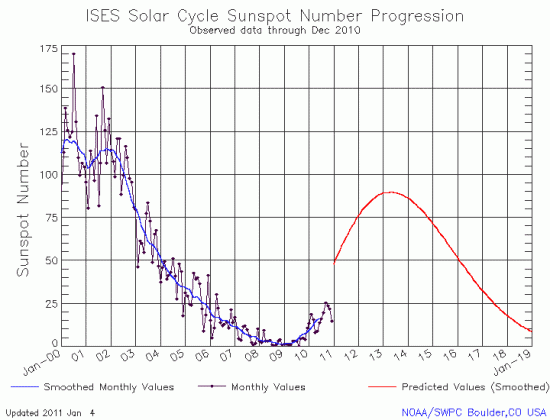
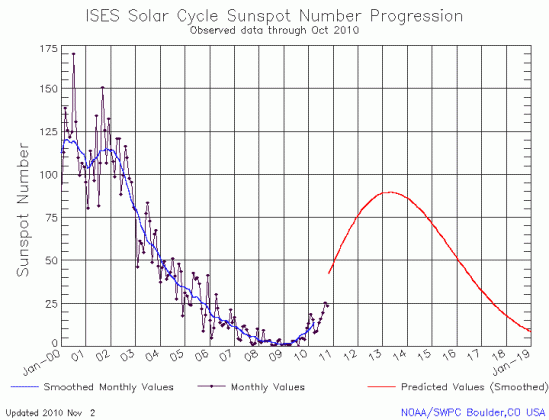
On Monday NOAA posted its monthly update of the solar cycle, showing the Sun’s sunspot activity in July. As I have done every month since 2010, I am posting it here, below the fold, with annotations to give it context.

Sunspot counts continue to decline at a rate faster than predicted or is usual during ramp down from solar maximum. Normally the ramp down is slow and steady. This time it has so far been more precipitous. While the 2009 prediction of the solar science community (indicated by the red curve) suggests minimum will occur sometime after 2020, the actual counts suggest it will occur much sooner.

» Read more

7 comments

A new double dynamo theory to explain the Sun’s solar cycle

A team of solar scientists have proposed a new theory that they think explains the ebb and flow of the Sun’s eleven year solar cycle, and if right can explain the periodic occurrence of grand minimums where there are essentially no sunspots for decades, such as the Maunder Minimum in the 1600s.

The theory proposes that the Sun has two different dynamos that produce different magnetic waves in its interior. Like waves that can either cancel each other out or combine for more power, these two dynamos do the same over time and thus effect the Sun’s sunspot/solar cycle.

“We found magnetic wave components appearing in pairs, originating in two different layers in the Sun’s interior. They both have a frequency of approximately 11 years, although this frequency is slightly different, and they are offset in time. Over the cycle, the waves fluctuate between the northern and southern hemispheres of the Sun. Combining both waves together and comparing to real data for the current solar cycle, we found that our predictions showed an accuracy of 97%,” said Zharkova.

Zharkova and her colleagues derived their model using a technique called ‘principal component analysis’ of the magnetic field observations from the Wilcox Solar Observatory in California. They examined three solar cycles-worth of magnetic field activity, covering the period from 1976-2008. In addition, they compared their predictions to average sunspot numbers, another strong marker of solar activity. All the predictions and observations were closely matched.

Looking ahead to the next solar cycles, the model predicts that the pair of waves become increasingly offset during Cycle 25, which peaks in 2022. During Cycle 26, which covers the decade from 2030-2040, the two waves will become exactly out of synch and this will cause a significant reduction in solar activity.

“In cycle 26, the two waves exactly mirror each other – peaking at the same time but in opposite hemispheres of the Sun. Their interaction will be disruptive, or they will nearly cancel each other. We predict that this will lead to the properties of a ‘Maunder minimum’,” said Zharkova. “Effectively, when the waves are approximately in phase, they can show strong interaction, or resonance, and we have strong solar activity. When they are out of phase, we have solar minimums. When there is full phase separation, we have the conditions last seen during the Maunder minimum, 370 years ago.”

And on this same subject, last week NOAA posted its monthly update of the solar cycle, showing the Sun’s sunspot activity in June. As I have done every month since 2010, I am posting it here, below the fold, with annotations to give it context.
» Read more

4 comments

Ramp down to solar minimum continues

On Sunday NOAA posted its monthly update of the solar cycle, showing the Sun’s sunspot activity in May. As I have done since 2010, I am posting it here, with annotations to give it context.

May 2015 Solar Cycle graph

The graph above has been modified to show the predictions of the solar science community. The green curves show the community’s two original predictions from April 2007, with half the scientists predicting a very strong maximum and half predicting a weak one. The red curve is their revised May 2009 prediction.

Sunspot activity once again increased in May, though it continues to remain below the 2009 prediction of activity. Though it is still early in the ramp down, a look at the present pattern suggests that (as I also noted last month) sunspot activity is declining much faster than normal. In the past, the ramp down after solar maximum was long and drawn out, while ramp up was much faster. This ramp down seems much more precipitous than past solar cycles.

I should add that in early April Sunspot Index and Long-term Solar Observations (SILSO) had declared that the peak of the solar maximum had occurred in April 2014, and that they could now sum up the overall weakness of this maximum.

Cycle 24 proves to be 30% weaker than the previous solar cycle, which reached 119.7 in July 2000, and thus belongs to the category of moderate cycles, like cycles 12 to 15, which were the norm in the late 19th and early 20th century. Compared to strong cycles, such cycles typically feature a broader maximum, with a 3-year plateau on top of which two or more surges of activity can produce sharp peaks of similar height.

I had missed this announcement when it was first posted. It is worth noting however, especially since their discussion in April is interesting to read in the context of what has happened since.

1 comment

The Sun drifts downward

NOAA today posted its monthly update of the solar cycle, showing the Sun’s sunspot activity in April. As always, I am posting it here, with annotations to give it context, as I have done since 2010.

April 2015 Solar Cycle graph

The graph above has been modified to show the predictions of the solar science community. The green curves show the community’s two original predictions from April 2007, with half the scientists predicting a very strong maximum and half predicting a weak one. The red curve is their revised May 2009 prediction.

Though sunspot activity increased in April, it remained well below the predicted numbers from the 2009 prediction, as has sunspot activity generally done for this entire solar cycle.

Note that if you extrapolate the red curve of the 2009 prediction down to its end you find that the solar minimum was predicted to occur sometime after 2020. Based on the rate of activity we have seen for the past year, it is very possible that the minimum will occur sooner, and will likely last longer.

But then again, the sun does what the sun wants to do. We don’t exactly understand the root causes of the solar cycle, and can only watch it unfold time after time as we try to peel back its mysteries.

1 comment

Sunspots crash in February


NOAA today posted its monthly update of the solar cycle, showing the sunspot activity for the Sun in February. As I have done monthly for the past five years, I am posting it here below the fold, with annotations to give it context.

In the past two months I have noted how the ramp down from solar maximum has closely tracked the 2009 prediction of the solar scientist community (indicated by the red curve).

In February, however, that close tracking ended, with sunspots plunging far below the prediction. Note also that sunspot activity in March has also been weak.

» Read more

2 comments

Another Falcon 9 launch success

The competition heats up: A Falcon 9 rocket today successfully put a NASA solar observation satellite into orbit.

They have also said that they have achieved splashdown of the first stage, though no details yet on how soft that splashdown was.

Update: SpaceX reports that “the first stage successfully soft landed in the Atlantic Ocean within 10 meters of its target. The vehicle was nicely vertical and the data captured during this test suggests a high probability of being able to land the stage on the drone ship in better weather.”

0 comments

Sunspot activity tracks prediction

On Monday NOAA posted its monthly update of the solar cycle, showing the sunspot activity for the Sun in January. As I do every month, I am posting it here below the fold, with annotations to give it context.

As I have noted previously, the ramp down from solar maximum continues to track the 2009 prediction of the solar scientist community (indicated by the red curve) quite closely. As NOAA also notes,

While awaiting final confirmation, all evidence points to the most recent solar maximum having peaked at 82 in April, 2014. This was within the expected range for the peak, but occurred significantly later than predicted.

Since their graph doesn’t show the entire curves for their predictions, the above statement seems reasonable. However, looking at the graph with those curves inserted (see my annotated graph below the fold), it becomes clear that not only did the peak occur much later than predicted, the maximum’s overall activity was also generally less than predicted.
» Read more

0 comments

Weather 90% go for Falcon 9 launch today

The weather looks almost perfect for tonight’s Falcon 9 launch.

The Falcon 9 will put a solar observation satellite into orbit. While many left wing media outlets will wax poetic about this is Al Gore’s satellite, it is hardly that. It might have been built initially under his misguided idea of creating a propaganda satellite to take daily images of the Earth (images that are essentially of little use for climate studies), DSCOVR has been very carefully redesigned to give it a real purpose, monitoring the solar activity of the Sun and providing a replacement/back-up for ACE, which is now more than a decade overdue for replacement.

The Falcon 9 launch will also attempt again to land intact its first stage on a floating barge. If this attempt succeeds the entire future of space travel will be reshaped.

0 comments

The sunspot cycle update for December

The monthly update by NOAA of the solar cycle, showing the sunspot activity for the Sun in December, was released this past weekend. As I do every month, I am posting it here, below the fold, with annotations to give it context.

Even though sunspot activity in December increased, the slow ramp down to solar minimum continues to track the 2009 prediction of the solar scientist community. The overall intensity of the solar maximum prior to 2014 was considerable less than this prediction, but the numbers throughout 2014 matched that prediction remarkably well.
» Read more

0 comments

Solar maximum ramp down continues

The monthly update by NOAA of the solar cycle, showing the sunspot activity for the Sun in November, was released on December 8, just before NOAA completely revamped its website. As I have been doing every month for the past four years, I am posting it here, with annotations to give it context.

As noted in previous months, the 2009 prediction of the solar scientist community is looking better and better with time. Though there was an increase in sunspot activity in November, the overall trend continues downward very close to that prediction, though at levels that have generally been less than predicted.

November 2014 Solar Cycle graph

The graph above has been modified to show the predictions of the solar science community. The green curves show the community’s two original predictions from April 2007, with half the scientists predicting a very strong maximum and half predicting a weak one. The red curve is their revised May 2009 prediction.

Future updates will depend on whether NOAA continues to track sunspots using these same standards. After much searching I was finally able to locate the graph above at this link, suggesting that at least for now, they are holding to these standards. I note however that the links to the 2007 and the 2009 solar cycle predictions have vanished down the memory hole. Fortunately, I still have this data, and can continue to annotate the graphs to compare prediction with actual data.

That they might have removed these predictions from their webpage however is a shame. I have emailed them to ask them about this and will let you know what I learn.

3 comments
1 16 17 18 19 20 32