Jupiter’s endless interweaving storms

Jupiter's endless interweaving storms

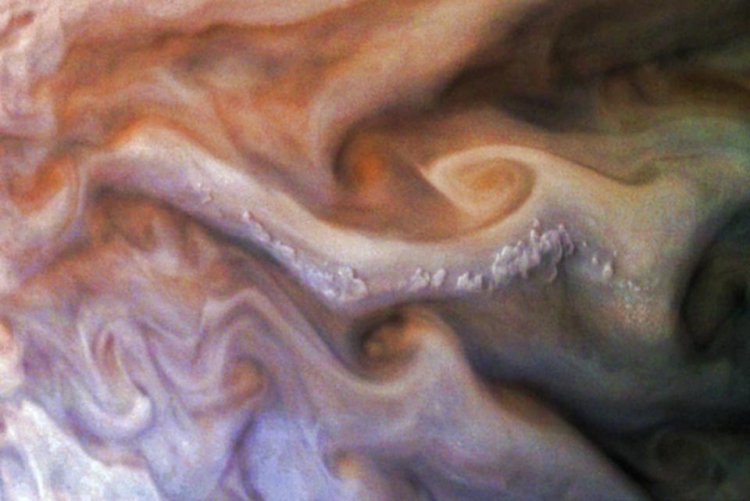
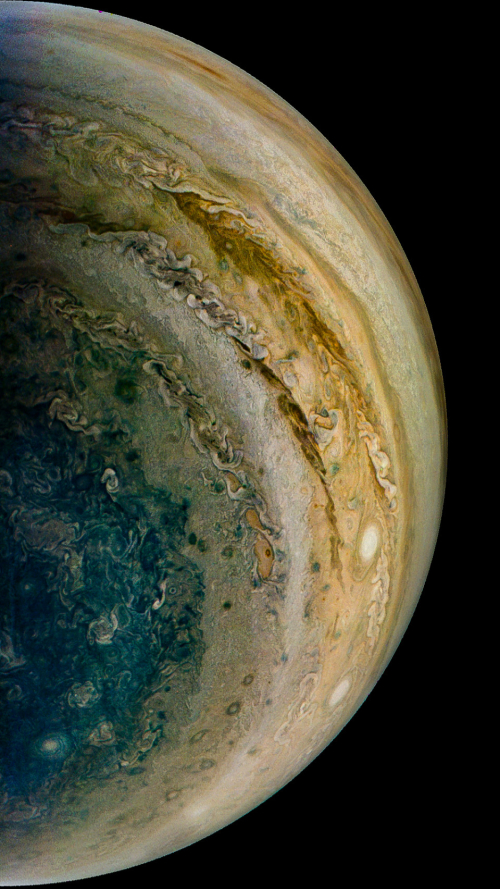
Cool image time! The photo to the right, rotated so that north is up and then reduced slightly to post here, was created by citizen scientist Thomas Thomopoulos from a raw photo taken by Juno during its 44th orbit of Jupiter.

To bring out the details Thomopoulos enhanced the colors, then enlarged the entire photo and cropped the area of interest.

Unfortunately, the Juno team that releases these photos does not provide information for easily establishing scale. In an email to me Thomopoulos noted that the largest circular storm in the northern half of the image is likely a vortex, which on Jupiter tend to range from 600 to 3,500 miles in diameter. He also noted that Juno was a little less than 27,000 miles away from Jupiter when this photo was snapped on August 17, 2022. Thus, I suspect this particular vortex sits on the larger end of that size range, which makes it a little less than half the size of the Earth.

As for the colors, as with many similar Juno images, the white clouds appear to almost always sit at the top of these storms and jets, almost like thunderheads.

Though the largest feature here is that large vortex to the north, most of the gigantic Jupiter storms visible seem instead to form as bands, the storms churning about madly as they are driven along the gas giant’s very fast ten hour rotation period.

Storm fronts on Jupiter

Storm front on Jupiter
Click for full image.

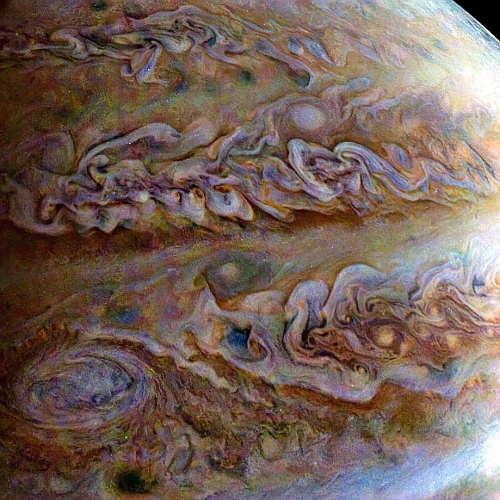
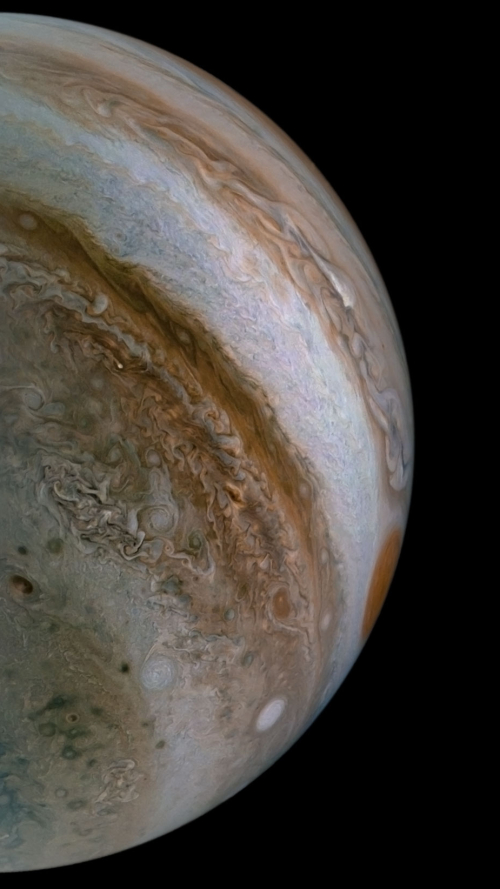
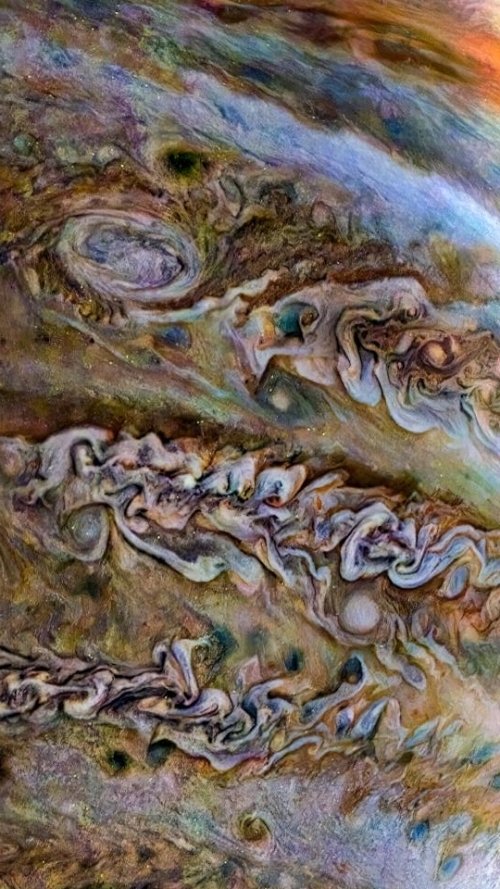
Cool image time! The picture to the right, cropped and reduced to post here, was processed by citizen scientist Thomas Thomopoulos from a raw image taken by the Jupiter orbiter Juno on August 17, 2022.

The orbiter was 18,354 miles above the cloud tops when the image was snapped. It shows a stormy cloud band in the southern hemisphere.

You can get a sense of the processing that Thomospoulos did by comparing this image with the raw photo. The original has almost no contrast, either in color or in contrast. By enhancing both Thomospoulos makes the violent nature of these large storms, thousands of miles in size, quite visible.

Jupiter’s internal structure, based on Juno data

Jupiter's internal structure
Click for original figure.

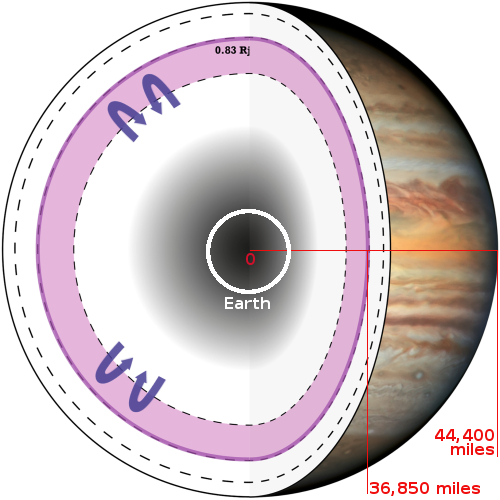
Scientists using Juno data of Jupiter’s magnetic field, combined with computer modeling, have now produced a rough map of the gas giant’s internal structure.

The image to the right, figure 2, of their paper, shows that structure. I have annotated the figure to provide some sense of scale. The bold violet line indicates their conclusions about the size of the dynamo that drives Jupiter’s powerful magnetic field, comprising more than 80 percent of the planet’s internal diameter. From the caption:

The gray area depicts the core (0.2 RJ) and the possible dilute core region. The violet area between the dotted lines (0.68 and 0.84 RJ) depicts the [hydrogen-helium] phase separated layer. The top dotted line at 0.95 RJ depicts the depth where the jets decay down to the minimum. The arrows represent possible convection area with unknown origin depth.

While this is a good first hypothesis based on the available data, that data remains quite sparse and uncertain. Thus, the conclusions here must be taken with a great deal of skepticism.

The big storms at Jupiter’s poles are coherent and stable

Storms on Jupiter
Click for full image.

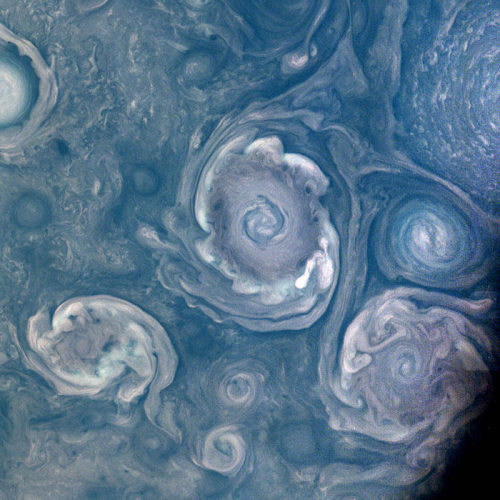
After four years of observations by Juno in orbit around Jupiter, scientists studying the storms at the gas giant’s poles have found that those storms are stable, long-lasting features. From the abstract of their paper:

These data have shown cyclones organized in snowflake-like structures. The Jupiter’s polar cyclones are long-lasting features, which did not disappear or merge during four years of observations.

The image to the right, posted by me earlier this week, shows several of these storms, or vortices, at Jupiter’s north pole. Previous work had documented the overall pattern, as described in the paper:

The observed vortices display geometrical symmetries around both poles: circumpolar cyclones (CPCs), organized in a regular pattern, surround a central one. At the north pole, eight circumpolar vortices form an octagonal structure, while at the south pole, five circumpolar vortices are arranged in a pentagonal pattern; both central polar vortices show some degree of displacements to the geometrical pole, about 0.5° for the Northern Polar Cyclone (NPC) and 1°-2° for the Southern Polar Cyclone (SPC).

While this research has found little change in these storms over four years, it is unknown what their long term evolution will be for an entire Jupiter year, twelve Earth years long.

A crowd of Jupiter hurricanes

Storms on Jupiter
Click for full image.

Cool image time! The photo to the right, cropped and reduced to post here, was taken on July 5, 2022 during Juno’s 43rd close fly-by of Jupiter, and was enhanced by citizen scientist Brian Swift. It shows a group of storms, what planetary scientists have labeled “vortices” near Jupiter’s north pole.

These powerful storms can be over 30 miles (50 kilometers) in height and hundreds of miles across. Figuring out how they form is key to understanding Jupiter’s atmosphere, as well as the fluid dynamics and cloud chemistry that create the planet’s other atmospheric features. Scientists are particularly interested in the vortices’ varying shapes, sizes, and colors. For example, cyclones, which spin counter-clockwise in the northern hemisphere and clockwise in the southern, and anti-cyclones, which rotate clockwise in the northern hemisphere and counter-clockwise in the southern hemisphere, exhibit very different colors and shapes.

The image highlights the type of storm Juno scientists are asking the pubic to category in a new citizen scientist project called Jovian Vortex Hunter. You go to its website and go through Juno images, noting and categorizing them. So far more than 2,400 volunteers have marked up more than 375,000 storms.

Jet streams on Jupiter

Jet streams on Jupiter
Click for full image.

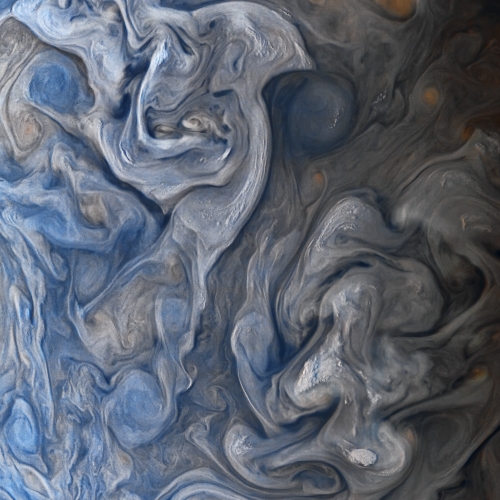
Cool image time! The photo to the right, cropped and reduced to post here, was created from a raw image from the Jupiter orbiter Juno by citizen scientist Sergio Diaz-Ruiz. As he notes in his caption:

Several jet streams at high latitude, near the north pole of the planet, crowned by clouds, contrast with a dark oval just over the center.

The original was taken on February 25, 2022 during Juno’s fortieth close approach to Jupiter. As Diaz-Ruiz notes, the contrast with the dark oval and the higher lighter clouds is striking. It is almost as if thermals rising over that oval are pushing the lighter clouds away.

This is only the fourth Juno image that Diaz-Ruiz has processed. All are quite stunning, and worth a look.

Looking down into a Jupiter hurricane

Looking down into a Jupiter hurricane
Click for full image.

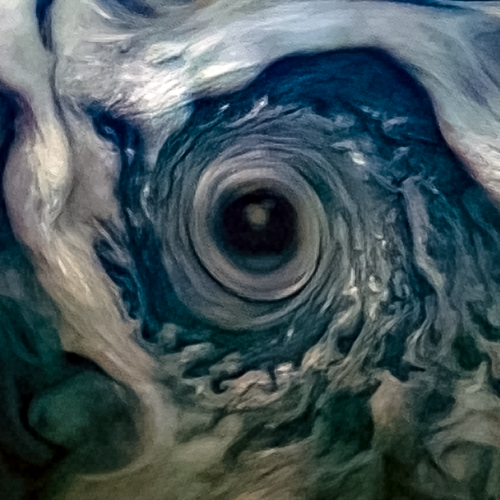
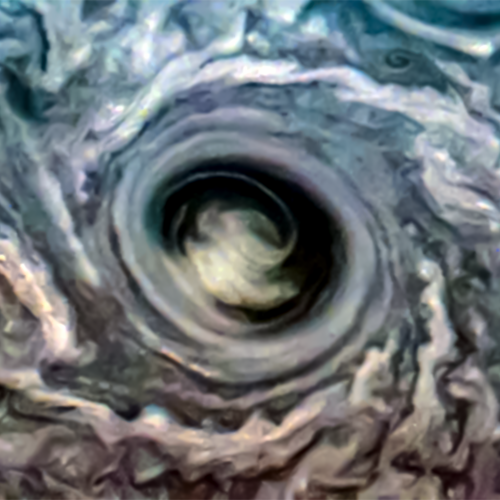
Cool image time! The photo to the right, cropped and reduced to post here, was created by citizen scientists Kevin Gill and Navaneeth Krishnan from a raw image taken by Juno during its 40th close fly-by of Jupiter in February 2022.

I don’t have a scale, but I would guess that this storm is at least a thousand miles across. The depth is harder to measure, but we looking down into a deep whirlpool for sure.

To bring out the details Gill and Krishnan enhanced the colors significantly. The original is quite bland in comparison, with this storm being the faint dark spot just below the center near the photo’s left edge.

Weird storms on Jupiter

Storms on Jupiter
Click for full image.

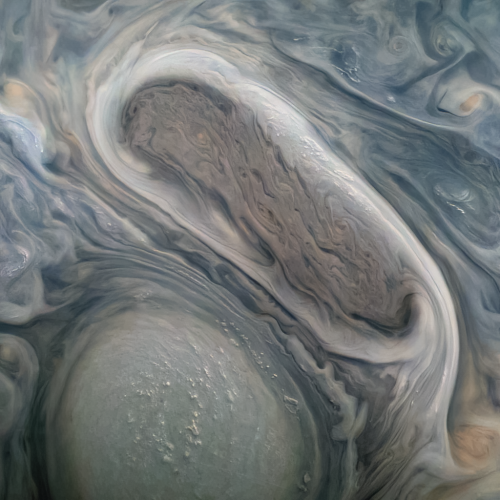
Cool image time! The photo to the right, reduced to post here, was taken during Juno’s 38th close fly-by of Jupiter. It was enhanced and released yesterday by citizen scientist Kevin Gill to bring out the storm details, both of the large white storm at the bottom of the photo and the oblong eddy in the center.

Note the white puffy clouds sticking up from both larger cyclones. These tiny thunderheads are probably about the size of a very large Earth storm, but I am guessing. I don’t know the scale, but I suspect the Earth would fit within this image.

The oblong storm is actually an eddy that is swirling around the white and more stable storm below it.

The stormy atmosphere of Jupiter

Jupiter's South South Temperate Belt
Click for full image.

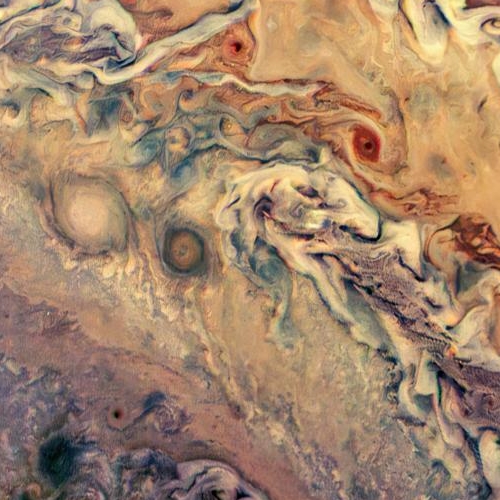
Cool image time! The photo to the right, cropped to post here, was created by citizen scientist Thomas Thomopoulo from a Juno image taken during its 16th close pass of Jupiter in 2018. To bring out the different colors of the clouds he enhanced the resolution and color contrast.

We have no scale, but I would guess the distances seen exceed several thousand miles. The area covered is what is called Jupiter’s South South Temperate Belt, the visible belt at about 40 degrees south latitude that circles the South Polar Region (which is the darker purple swirls in the bottom left). This belt is difficult to observe from Earth because of its high latitude, with the curve of Jupiter’s limb beginning to bend away from view.

Skimming over the cloud tops of Jupiter

Skimming over the cloud tops of Jupiter
Click for full image.

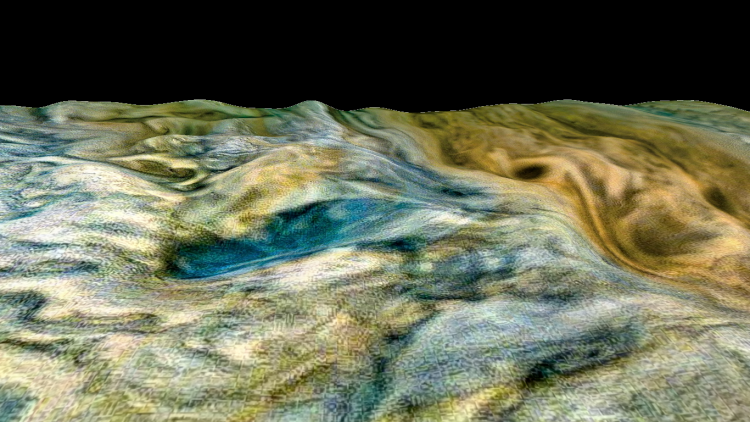
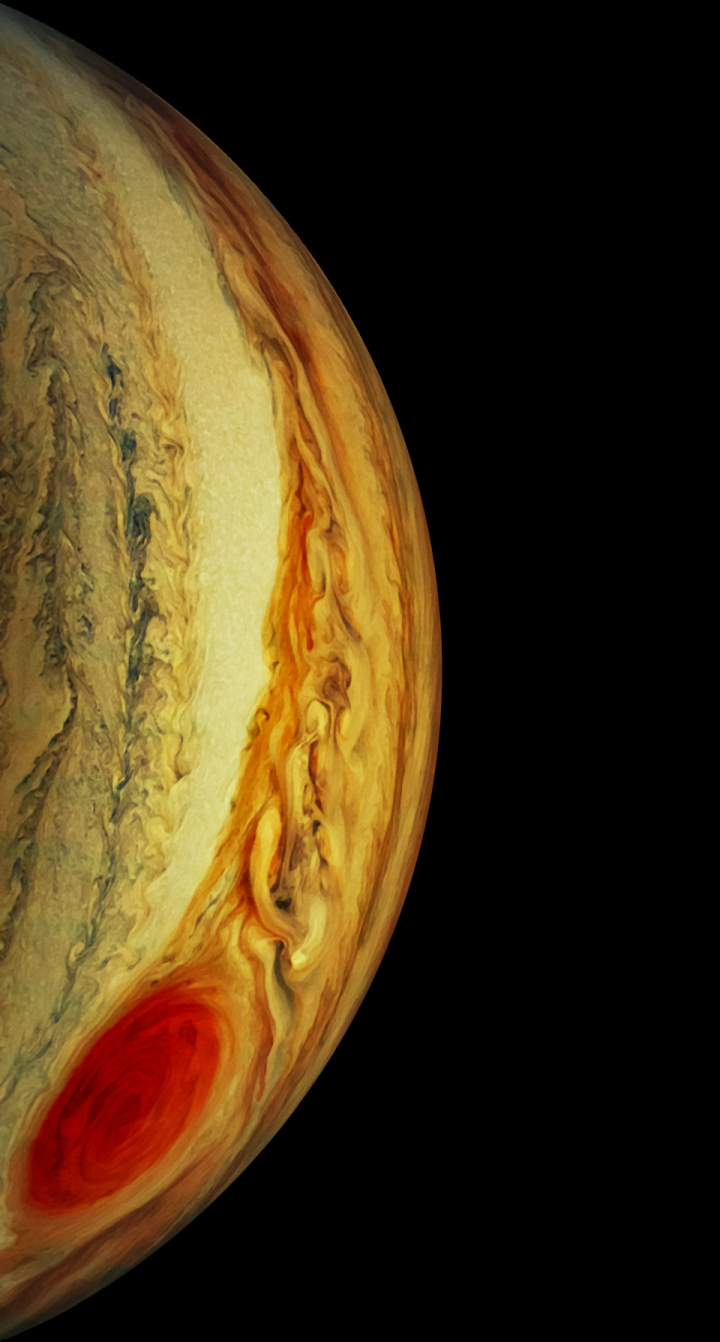
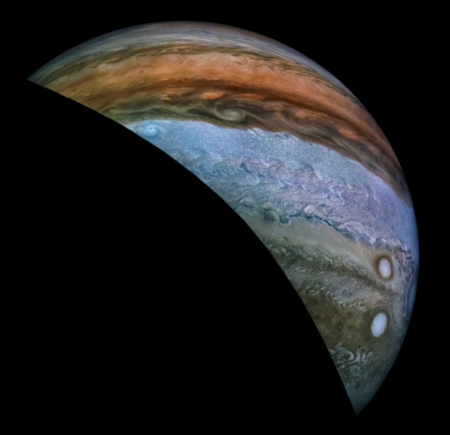
Cool image time! The computer visualization above is based on a orbital image of Jupiter taken by Juno, but processed by citizen scientist Ryan Cornell to give, as he puts it, a view “as if we had a low orbit above the clouds.”

I estimate the scale of these clouds is quite large, with the Earth easily fitting inside the orange band on the right. The sharp horizon edge is a not accurate, however, as the clouds would have a decidedly fuzzy boundary, possibly many thousand miles in extent.

Nonetheless, it is a fun image that begins to give us a sense of Jupiter’s upper atmosphere.

New results about Jupiter published from Juno

Three new papers published today in the journals Science and the Journal of Geophysical Research: Planets reveal in more detail the depth of Jupiter’s storms and clouds, using a variety of different sensors and techniques.

The papers can be found here, here, and here.

Juno’s microwave radiometer (MWR) allows mission scientists to peer beneath Jupiter’s cloud tops and probe the structure of its numerous vortex storms. The most famous of these storms is the iconic anticyclone known as the Great Red Spot. Wider than Earth, this crimson vortex has intrigued scientists since its discovery almost two centuries ago.

The new results show that the cyclones are warmer on top, with lower atmospheric densities, while they are colder at the bottom, with higher densities. Anticyclones, which rotate in the opposite direction, are colder at the top but warmer at the bottom.

The findings also indicate these storms are far taller than expected, with some extending 60 miles (100 kilometers) below the cloud tops and others, including the Great Red Spot, extending over 200 miles (350 kilometers). This surprise discovery demonstrates that the vortices cover regions beyond those where water condenses and clouds form, below the depth where sunlight warms the atmosphere.

The height and size of the Great Red Spot means the concentration of atmospheric mass within the storm potentially could be detectable by instruments studying Jupiter’s gravity field. Two close Juno flybys over Jupiter’s most famous spot provided the opportunity to search for the storm’s gravity signature and complement the MWR results on its depth.

With Juno traveling low over Jupiter’s cloud deck at about 130,000 mph (209,000 kph) Juno scientists were able to measure velocity changes as small 0.01 millimeter per second using a NASA’s Deep Space Network tracking antenna, from a distance of more than 400 million miles (650 million kilometers). This enabled the team to constrain the depth of the Great Red Spot to about 300 miles (500 kilometers) below the cloud tops.

The data from these two techniques confirms that the base of the Great Red Spot is somewhere between 200 to 300 miles below the cloud tops, much deeper than most of the other storms, though even those storms are deeper than expected.

Another paper published earlier in Geophysical Research Letters looked at the storms in Jupiter’s polar regions, and found their polygonal arrangement around the poles appears stable and caused by a balanced push between these surrounding storms, trying to move to the poles, and the storms at the poles pushing back.

Pop-up clouds on Jupiter

Pop-up clouds on Jupiter
Click for full image.

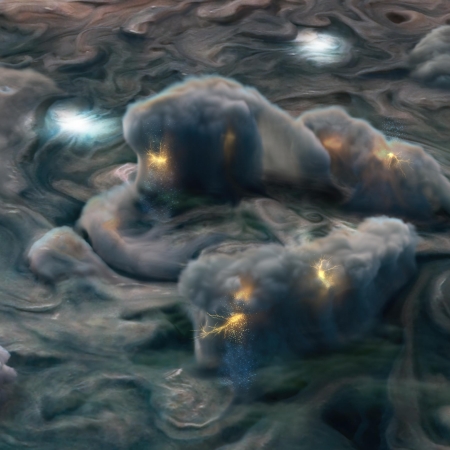
Cool image time! The photo above was cropped and enhanced by citizen scientist Gerald Eichstädt from a raw Juno image taken during that spacecraft’s 37th orbit. I have reduced it slightly to post here.

The photo shows what he calls “pop-up” clouds floating above a much larger cloud eddy. Unfortunately, Eichstädt provides no scale, but I suspect this image would easily cover the Earth, with those white clouds probably far larger than the biggest hurricane on Earth.

Juno team creates dramatic animation of Ganymede/Jupiter fly-by

Using images from Juno’s fly-by of both Ganymede and Jupiter on June 7th and 8th, the science team has produced a dramatic animation, with background music, showing that fly-by from the point of view of the spacecraft.

I have embedded it below the fold.

The 3:30-minute-long animation begins with Juno approaching Ganymede, passing within 645 miles (1,038 kilometers) of the surface at a relative velocity of 41,600 mph (67,000 kph). The imagery shows several of the moon’s dark and light regions (darker regions are believed to result from ice sublimating into the surrounding vacuum, leaving behind darkened residue) as well as the crater Tros, which is among the largest and brightest crater scars on Ganymede.

It takes just 14 hours, 50 minutes for Juno to travel the 735,000 miles (1.18 million kilometers) between Ganymede and Jupiter, and the viewer is transported to within just 2,100 miles (3,400 kilometers) above Jupiter’s spectacular cloud tops. By that point, Jupiter’s powerful gravity has accelerated the spacecraft to almost 130,000 mph (210,000 kph) relative to the planet.

Among the Jovian atmospheric features that can be seen are the circumpolar cyclones at the north pole and five of the gas giant’s “string of pearls” – eight massive storms rotating counterclockwise in the southern hemisphere that appear as white ovals. Using information that Juno has learned from studying Jupiter’s atmosphere, the animation team simulated lightning one might see as we pass over Jupiter’s giant thunderstorms.

The lightning shown on Jupiter, while entertaining, is a complete fantasy. The flashes are much too bright and large. At the scale created, some would cover the Earth. In reality, that lightning wouldn’t be visible until you are very very close, and even then probably difficult to spot in the vastness of Jupiter.

» Read more

Craters on Ganymede’s striped surface

Craters on Ganymede
Click for full image.

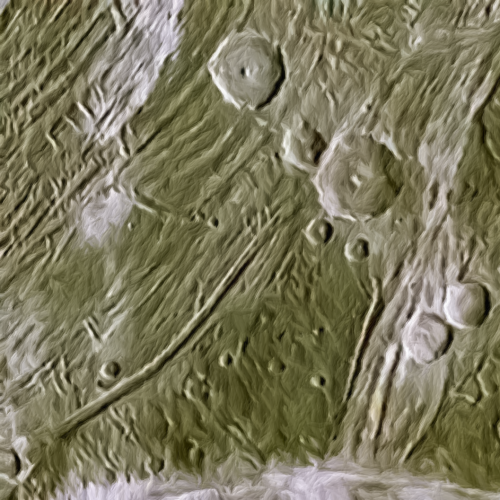
Cool image time! The photo to the right, cropped to post here, is a color enhanced section taken from of one of the images taken by Juno when it did a close fly-by of the Jupiter moon Ganymede back on June 7, 2021.

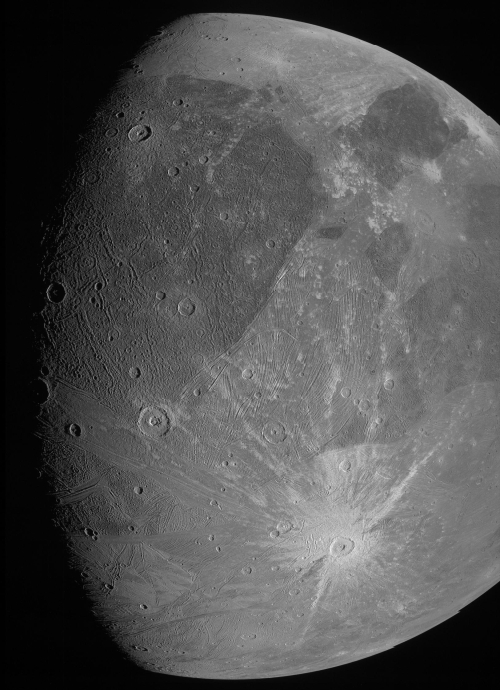
The enhancement was done by citizen scientist Navaneeth Krishnan, using a wider Juno image of Ganymeded enhanced by citizen scientist Kevin Gill. That wider image is below, and marks the area covered by this first image with a white box.

In this one picture we can see many of the geological mysteries that have puzzled scientists since the Galileo orbiter first took close-up images back in the 1990s. We can see patches of grooved terrain with the grooves in the different patches often oriented differently. We can also see bright and dark patches that while they overlay the grooved terrain they bear no correspondence to those grooved patches. And on top of it all are these small craters, impacts that obviously occurred after the formation of the grooves.
» Read more

Juno takes first close-up images of Ganymede since 2000

Ganymede as seen by Juno
Click for full image.

Ganymede as seen by Juno
Click for full image.

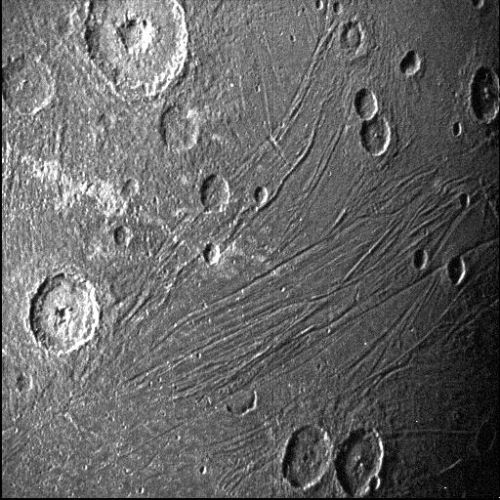
On June 7th the Jupiter orbiter Juno made its first close fly-by of Ganymede, taking the first close-up images of this Jupiter moon since the orbiter Galileo flew past in 2000.

The first two images from NASA Juno’s June 7, 2021, flyby of Jupiter’s giant moon Ganymede have been received on Earth. The photos – one from the Jupiter orbiter’s JunoCam imager and the other from its Stellar Reference Unit star camera – show the surface in remarkable detail, including craters, clearly distinct dark and bright terrain, and long structural features possibly linked to tectonic faults.

…Using its green filter, the spacecraft’s JunoCam visible-light imager captured almost an entire side of the water-ice-encrusted moon. Later, when versions of the same image come down incorporating the camera’s red and blue filters, imaging experts will be able to provide a color portrait of Ganymede. Image resolution is about 0.6 miles (1 kilometer) per pixel.

In addition, Juno’s Stellar Reference Unit, a navigation camera that keeps the spacecraft on course, provided a black-and-white picture of Ganymede’s dark side (the side opposite the Sun) bathed in dim light scattered off Jupiter. Image resolution is between 0.37 to 0.56 miles (600 to 900 meters) per pixel.

Both images are to the right, each slightly reduced to post here. These images of this moon of Jupiter, the largest moon in the solar system and about 26% larger than the planet Mercury, reveal many of the same unsolved geological mysteries uncovered when the Galileo orbiter photographed it two decades ago. As I wrote in my Chronological Encyclopedia

Closer inspection of Ganymede revealed a strange topography, including patches of grooved terrain (not unlike the surface of a vinyl record) overlaying other patches of grooved terrain, the different patches oriented in random and totally unrelated directions. Moreover, the surface is overlain by bright and dark patches (the bright patches thought to be caused by water frost) that often had no apparent correspondence to topographical features. Planetary geologists could only scratch their heads in wonderment.

Jupiter’s changing and unchanging Great Red Spot

The changing Great Red Spot of Jupiter
Click for full figure.

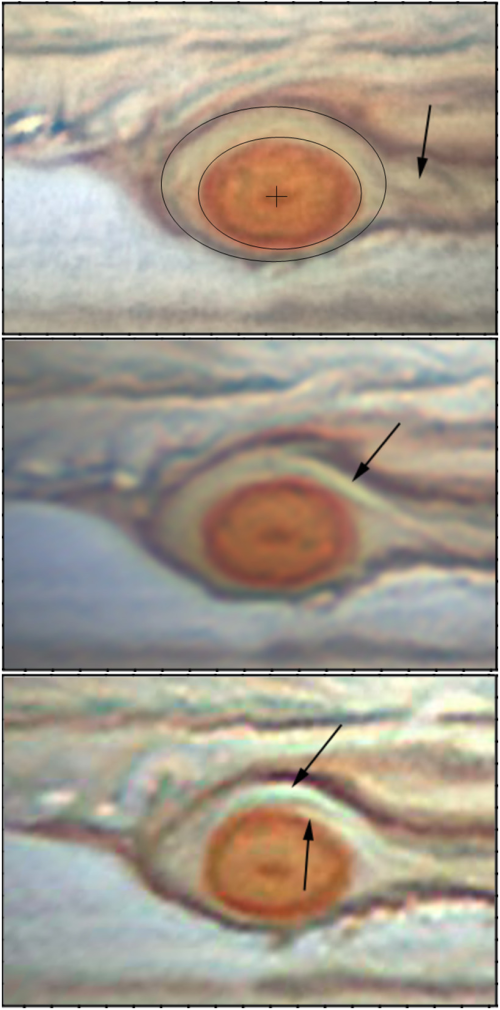
In a paper published in March in the Journal of Geophysical Research: Planets, scientists (using images from amateurs, the Hubble Space Telescope, and Juno, scientists) have mapped out the interactions between Jupiter’s Great Red Spot, the longest known storm on the gas giant, and the smaller storms that interact with it as they zip past.

The series of images to the right come from figure 5 of their paper, showing the Spot over a period of three days. The Spot in these images is about 9,000 miles across, less than half the size it had been back in the late 1800s.

The black arrows mark the shifting location and shape of one smaller vortice as it flowed past the Spot from east to west along its northern perimeter, ripping off portions of the Spot as it passed. From the paper’s absract:

During its history, the [Great Red Spot] has shrunk to half its size since 1879, and encountered many smaller anticyclones and other dynamical features that interacted in a complex way. In 2018–2020, while having a historically small size, its structure and even its survival appeared to be threatened when a series of anticyclones moving in from the east tore off large fragments of the red area and distorted its shape. In this work, we report observations of the dynamics of these interactions and show that as a result the [Spot] increased its internal rotation velocity, maintaining its vorticity but decreasing its visible area, and suffering a transient change in its otherwise steady 90‐day oscillation in longitude.

…From the analysis of the reflectivity of the [Spot] and flakes and model simulations of the dynamics of the interactions we find that these events are likely to have been superficial, not affecting the full depth of the [Spot]. The interactions are not necessarily destructive but can transfer energy to the [Spot], maintaining it in a steady state and guaranteeing its long lifetime.

In other words, the changes seen only involved the Spot’s cloud tops, even if those tops were many miles thick. The storm itself is much deeper, with its base embedded strongly inside Jupiter and largely unaffected by these passing smaller storms.

Why the Spot exists and remains so long-lived remains an unsolved mystery.

Looking into one of Jupiter’s smaller cyclones

A northern cyclone on Jupiter
Click for full image.

Cool image time! The photo to the right, cropped and reduced to post here, was taken by the Juno probe orbiting Jupiter and enhanced first by citizen scientist Kenneth Gill and then further enhanced by citizen scientist Navaneeth Krishnan.

Sadly all the link tells us about this storm is that it is in the northern hemisphere. Based upon the colors, my guess is that it located at the high latitude where Jupiter’s bands transition to the chaotic region of storms at the poles, as seen in this earlier wide image of the gas giant’s south pole.

No scale is provided, but an earlier image of other northern hemisphere storms suggests this storm would probably cover the state of Arizona.

Jupiter’s southern jet streams

Jupiter's southern jet streams
Click for full image.

Cool image time! The photo to the right, rotated and reduced slightly to post here, shows the southern jet streams in Jupiter’s atmosphere. From the press release:

The storm known as the Great Red Spot is also visible on the horizon, nearly rotated out of view as Juno sped away from Jupiter at about 30 miles per second (48 kilometers per second), which is more than 100,000 mph (160,900 kilometers per hour).

Citizen scientist Tanya Oleksuik created this color-enhanced image using data from the JunoCam camera. The original image was taken on Dec. 30, 2020 as the Juno spacecraft performed its 31st close flyby of Jupiter. At the time, the spacecraft was about 31,000 miles (about 50,000 kilometers) from the planet’s cloud tops, at a latitude of about 50 degrees South.

According to data obtained by Juno, these bands of storms extend about 1,800 miles into Jupiter’s interior, much deeper than expected.

The Great Red Spot is at about 22 degrees south latitude, so this tells us that this picture covers Jupiter’s southern hemisphere from about the equator down to about 80 degrees.

NASA extends mission of Juno and InSight probes

NASA has decided to extend the missions of Juno and InSight probes, giving both several more years to gather data.

InSight main goal for the two-year extension will be to gather more seismic data of Mars. They will also continue their efforts to get the heat sensor into the ground, but that will have a lower priority.

Juno will be able to slowly adjust its orbit to better study Jupiter’s north polar regions, thus developing a more complete first rough map of the gas giant’s internal structure and atmosphere. The changing orbit will also allow the first close fly-bys of some of Jupiter’s moons, the first in more than twenty years.

The moon flybys could begin in mid-2021 with an encounter with Ganymede, Jupiter’s largest moon, at a distance of roughly 600 miles (1,000 kilometers), Bolton said last year.

After a series of distant passes, Juno will swoop just 200 miles (320 kilometers) above Europa in late 2022 for a high-speed flyby. Only NASA’s Galileo spacecraft, which ended its mission in 2003, has come closer to Europa.

There are two encounters with Jupiter’s volcanic moon Io planned in 2024 at distances of about 900 miles (1,500 kilometers), according to the flight plan presented by Bolton last year. Juno will be able to look for changes on the surfaces of Jupiter’s moons since they were last seen up close by NASA’s Voyager and Galileo probes.

While it will take images, Juno’s camera is not particularly high resolution. The main effort will be to use its instruments to study the surface make-up of the moons.

Jupiter’s stormy southern polar regions

Jupiter's polar regions
Click for full image.

Cool image time! The photo to the right shows the southern polar regions of Jupiter. The image, taken by Juno during its 29th close-fly of Jupiter, was enhanced by a citizen scientist who only goes by the nickname Flury-21. This in fact was this person’s first try at enhancing a Juno image. He or she did a nice job, but provided no additional information other than saying that he “used lightroom to enhance the image and mostly used the dehaze effect.”

Works nicely nonetheless to illustrate how the bands that dominate Jupiter’s equatorial and mid-latitude regions disappear at the pole. Instead, the pole is a region of chaotic independent hurricanes, many bigger than North America. Other images from Juno suggest that they change relatively quickly. For example, compare this image of the south pole with an earlier one taken during the 28th fly-by. While we might not be looking at the same hemisphere, it is hard to believe there is no overlap between both images. Yet I can find no corresponding features.

The two images of course were taken months apart, and thus it is not surprising the storms have changed completely. However, I also suspect, given their size, that even over this time span some storms have survived, but changed so much it is hard to link them together. The only way to do this would be to have an orbiter close enough all the time to make movies. Unfortunately, Juno cannot do this, and I don’t expect any orbiter like this to reach Jupiter for many decades.

Analyzing the evolving “small” storms in Jupiter’s atmosphere

The vortices in Jupiter's polar regions
Click for full image.

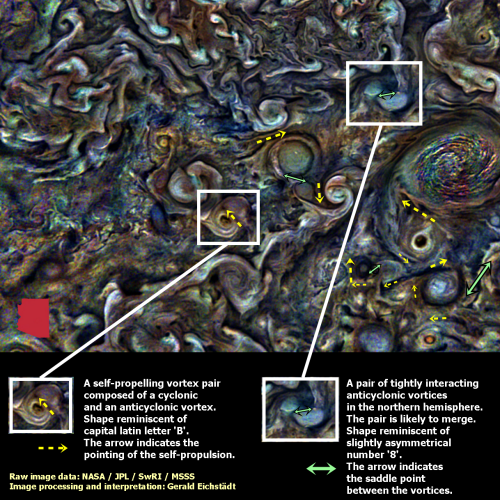
The cool image to the right is another Juno photo of Jupiter enhanced by citizen scientist Gerald Eichstädt. This time Eichstädt also did some analysis of the motions and interactions of many vortices found in the northern polar regions of Jupiter. The image to the right has been cropped and reduced to post here, with the state of Arizona, about 400 by 300 miles in size, added for scale. There is more annotation in the full image.

As Eichstädt writes:

Large vortices in an atmosphere layer of a rotating planet can be roughly split into two classes, cyclonic and anticyclonic vortices.

Based on this rough classification, two interacting vortices can either be of the same or of opposite sign. Tightly interacting vortices of opposite sign tend to mutually propel each other, hence the whole pair, if they are of similar strength and size.

Tightly interacting vortex pairs of the same sign tend to merge. More distant like-signed vortex pairs may essentially repel each other. Interacting vortices tend to create filaments, some of which may split into fragments and further collapse into streets of small eddies.

He also notes that in future orbits Juno will provide closer views of this stormy region, as with the orbit the closest point shifts northward.

The face on Jupiter

The face on Jupiter!

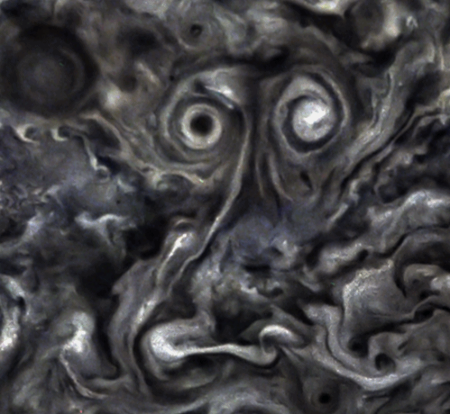
Citizen scientist Gerald Eichstädt has created a two-image blink animation from Juno images of Jupiter that shows the changes in the two oppositely rotating storm vortices, shown on the right. As he notes.

Two vortices or eddies, one cyclonic, the other one anticyclonic, can propell themselves mutually and slowly within the overall context they are embedded in.

…The rotation of the two vortices is perceptible in the image sequence taken within nine minutes. The cyclonic eddy is located at the left, the anticyclonic one at the right. The motion of the vortex pair, however, is too slow to be resolved. But the morphology of the cloud tops points towards a relative upward motion in this rendition.

That the two storms also invoke face I am sure also had something to do with his decision to showcase this data. Unlike the face on Mars, this face is real, though relatively temporary. It will eventually break apart as Jupiter’s storms evolve.

The animation can be seen at the link.

Juno science team proposes fly-bys of Jupiter’s moons

The Juno science team has proposed doing fly-bys of three of Jupiter’s moons, should NASA extend the mission beyond ’21.

Juno’s five-year primary mission phase ends in July 2021, and mission managers have proposed an extension that would continue operations until September 2025. The spacecraft’s additional orbits around Jupiter will bring Juno closer to the planet’s moons, allowing for a more diversified set of scientific targets.

…The moon flybys would begin in mid-2021 with an encounter with Ganymede, Jupiter’s largest moon, at a distance of roughly 600 miles (1,000 kilometers), according to Bolton.

After a series of distant passes, Juno would swoop just 200 miles (320 kilometers) above Europa in late 2022 for a high-speed flyby. Only NASA’s Galileo spacecraft, which ended its mission in 2003, has come closer to Europa.

There are two encounters with Jupiter’s volcanic moon Io planned in 2024 at distances of about 900 miles (1,500 kilometers), according to the flight plan presented by Bolton last month.

The extended mission would also allow scientists to get a better look at Jupiter’s north pole.

NASA will decide on the extension by the end of the year. From a cost and scientific perspective, it makes perfect sense to extend this mission for as long as possible. Compared to launching a new mission, extending an active one is far cheaper. It is also already in place.

Flying over Jupiter

Cool movie time! Using images produced by Juno in orbit around Jupiter, citizen scientist Kevin Gill has produced a very nice movie of the spacecraft’s 27th fly-by on June 2, 2020.

During the closest approach of this pass, the Juno spacecraft came within approximately 2,100 miles (3,400 kilometers) of Jupiter’s cloud tops. At that point, Jupiter’s powerful gravity accelerated the spacecraft to tremendous speed — about 130,000 mph (209,000 kilometers per hour) relative to the planet.

I have embedded the movie below the fold. The choice of a piece of music by Vangellis might seem hokey, but I think in this case it works very nicely. I also was impressed with the addition of some 3D depth near the movie’s beginning.
» Read more

Juno’s 28th fly-by of Jupiter

Cool movie time! Below is a short movie created by citizen scientist Gerald Eichstädt from images taken by Juno as it swung past Jupiter on its 28th close pass since arriving in orbit in 2016.

In natural colors, Jupiter looks pretty pale. Therefore, the still images are approximately illumination-adusted, i.e. almost flattened, and consecutively gamma-stretched to the 4th power of radiometric values, in order to enhance contrast and color.

Like for all its previous flybys, Juno approached Jupiter roughly from north, and left Jupiter looking towards the soutern hemisphere. Closest approach to Jupiter was 3,500 km above the nominal IAU 1-bar level, and near 25.3 degrees north (planetocentric), according to long-term planning of November 2017.

Lightning and mushballs on Jupiter

Artist's illustration of Jupiter lightning
Click for full illustration.

Using data from Juno, scientists now theorize that Jupiter produces what they dub “shallow lightning” as well as ammonia-water hailstones dubbed “mushballs.”

The image to the right, cropped and reduced to post here, is only an artist’s illustration of the lightning. Sadly Juno’s camera doesn’t have the resolution to capture such flashes.

An unexpected form of electrical discharge, shallow lightning originates from clouds containing an ammonia-water solution, whereas lightning on Earth originates from water clouds.

Other new findings suggest the violent thunderstorms for which the gas giant is known may form slushy ammonia-rich hailstones Juno’s science team calls “mushballs”; they theorize that mushballs essentially kidnap ammonia and water in the upper atmosphere and carry them into the depths of Jupiter’s atmosphere.

As with the InSight results below, there is much uncertainty with these results, especially the hypothesis of mushballs. These features fit their present data from Juno, but we must remember that the data is still somewhat superficial.

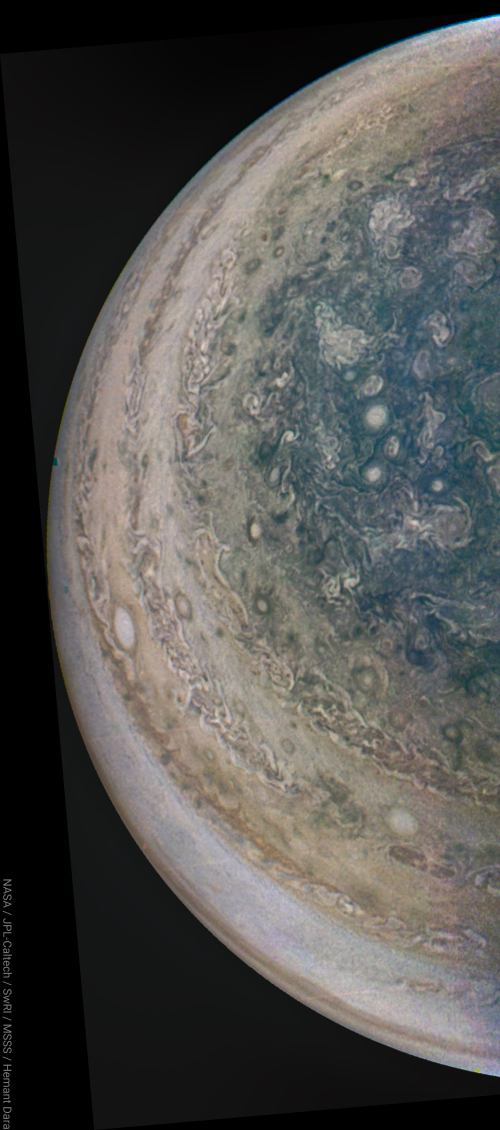
Jupiter’s south pole

The storms at the south pole of Jupiter
Click for full image.

Cool image time! The photo to the right, rotated and reduced to post here, was taken by Juno during its 28th close orbital fly-by of Jupiter, and then processed by citizen scientist Hemant Dara.

While not the first Juno image of the poles of Jupiter, this photo illustrates very well the evolution of the gas giant’s deep atmosphere as you move from the equator to the pole. From the equator to the high mid-latitudes the planet’s rotation, producing a day only 10 hours long, organizes that atmosphere into jet streams that form the bands that astronomers have spied from Earth since the first telescopes.

At the pole the influence of that rotation seems to wane, or at least influence the atmosphere differently, so that the storms seem to form randomly and incoherently.

The image also shows that there appear to be several types of storms at the south pole. Some appear as tight spirals, similar to hurricanes. Others appear chaotic, with no consistent shape, almost like clouds on Earth.

The processes that would explain all this are not yet understood, in the slightest, and won’t be until we get orbiters at Jupiter able to watch the atmosphere continuously, as we do here on Earth. Then it will be possible to assemble movies of the formation and dissipation of these storms, and begin (only begin) to decipher what causes them.

New storm outbreak on Jupiter

Clyde's Spot
Click for full image.

A new storm, dubbed Clyde’s spot after its discoverer, developed suddenly in late May on Jupiter, and has been imaged by Juno during its most recent close fly-by of the gas giant planet.

The image to the right, cropped to post here, focuses in on this spot. It is the feature in the center of the full image, with the Great Red Spot to the upper left.

The new feature was discovered by amateur astronomer Clyde Foster of Centurion, South Africa. Early on the morning of May 31, 2020, while imaging Jupiter with his telescope, Foster noticed a new spot, which appeared bright as seen through a filter sensitive to wavelengths of light where methane gas in Jupiter’s atmosphere has strong absorption. The spot was not visible in images captured just hours earlier by astronomers in Australia.

On June 2, 2020, just two days after Clyde Foster’s observations, Juno performed its 27th close flyby of Jupiter. The spacecraft can only image a relatively thin slice of Jupiter’s cloud tops during each pass. Although Juno would not be travelling directly over the outbreak, the track was close enough that the mission team determined the spacecraft would obtain a detailed view of the new feature, which has been informally dubbed “Clyde’s Spot.”

The feature is a plume of cloud material erupting above the upper cloud layers of the Jovian atmosphere. These powerful convective “outbreaks” occasionally erupt in this latitude band, known as the South Temperate Belt

The coolest thing about this is that the storm was spotted by an amateur, using a ground-based telescope, within hours of its inception.

Jupiter in glorious color

Jupiter in glorious color
Click for full image.

Cool image time! The photograph on the right, reduced to post here, was color enhanced by citizen scientist Emma Walimaki from the original Juno image in order to bring out the features and storms visible in the upper storm layers of Jupiter.

The photo was taken during Juno’s 25th close fly-by of the gas giant, and thus we are only seeing a small portion of Jupiter’s sphere.

In comparing this image with the original, it appears that Walimaki simply made the colors that were already there brighter and more distinctive. Thus, these colors represent real data. Jupiter’s cloud tops are really blue, orange, tan, and brown, unlike Earth’s consistently and boringly white water clouds.

1 2 3 4 6