North American mountains get 3Xs the snow previously estimated

The uncertainty of science: A new analysis based on computer models suggests that the mountains of North America get three times more snow each year than scientists has previously estimated.

Those figures come thanks to a new analysis in which researchers used computer simulations to estimate the typical annual snowfall in each of 11 North American mountain ranges. After supercomputer simulations of regional climate that would have taken 50 years on the average laptop, the team found that those mountain ranges receive about 3018 cubic kilometers of snow a year. Although those ranges together cover only about 25% of the area stretching from the Arctic Ocean down to Mexico’s southern border, they get about 60% of its snow, the researchers report in Geophysical Research Letters. That’s nearly three times the estimate for mountain snow from one previous study, the team notes.

First, this is based on computer simulations, not actual data in the field. I wouldn’t put much money on it. Second, it does show us how little climate scientists really know about the climate, as this simulation is still using all the knowledge they have, and it comes up with a conclusion that confounds them. Third, I was astonished the article didn’t try to push the idea that this larger estimate should be blamed on human-caused global warming. It didn’t, which I suppose is a sign of some progress.

0 comments

More evidence of data tampering at NOAA

A close review of NOAA’s historic temperature data for New York shows that the agency appears to have been adjusting its records to cool past records or warm recent ones, without any explanation.

The author took a look at NOAA’s graph this year showing New York’s average January temperatures going back to 1890, and noticed that, according to that graph, 1943 was 0.9 degrees Fahrenheit warmer than 2014. Yet, a close look at the actual data from 1943 strongly suggested that 1943 was actually 2.7F warmer, not 0.9F. Somehow, NOAA had adjusted the numbers, either in 1943 or in 2014, to make the present warmer or the past colder. Further analysis, removing the one station that appears to have experienced the most heat island influence, thus distorting its long term record, suggested the adjustments might actually be worse.

These results, while certainly not covering all weather stations and years, are still consistent with every other close look at NOAA’s adjustments. Those adjustments always cool the past and warm the present, so as to provide confirmation of the theory of global warming. More important, there is never any explanation for those adjustments.

Of the seven sites, six have remained at the same locations, within a few yards. The station at Auburn has moved by a couple of miles, but is still in similar terrain.

There is no reason then why any major adjustments should have been required at any site.

Apologists for temperature tampering usually say it is all due to TOBS (Time of Observation). Yet the station at Ithaca, based at Cornell University, has used morning readings throughout. With a temperature difference of 2.9C, this is typical of the other sites, suggesting that any bias from TOBS is minor.

Either there is outright fraud going on here in the climate divisions at NOAA, or they are entirely blind to their own confirmation bias. Either way, this data once again illustrates why there is great distrust in their results. Global warming might be happening, and human activity might be causing it, but these strange adjustments in the data leave many in doubt.

3 comments

Sunspot update for January 2018

Today NOAA posted its monthly update of the solar cycle, covering sunspot activity for January 2018. Below is my annotated version of that graph.

As you can see, the low sunspot activity of the past two months continued in January. November 2017 remains the most inactive month for sunspots since the middle of 2009. January is now the second most inactive month, with December a very close third.

January 2018 Solar Cycle graph

The graph above has been modified to show the predictions of the solar science community. The green curves show the community’s two original predictions from April 2007, with half the scientists predicting a very strong maximum and half predicting a weak one. The red curve is their revised May 2009 prediction.

Though activity continues to track close to but considerably below the 2007 weak prediction, the difference appears to be increasing as the ramp down to solar minimum continues. While I have said in past updates that the trend suggests an early arrival of the solar minimum, a close look at the previous ramp down in 2007 and 2008 shows that when activity became this weak, the ramp down slowed considerably. This previous pattern suggests that we could see another year or two of similarly low activity before the minimum arrives.

Regardless, the low activity, this soon, continues to suggest that the next maximum will also be weak, and might even not come at all, as some solar scientists have proposed. Instead, we might be heading toward another Grand Minimum, with no significant sunspots for decades.

Will that Grand Minimum produce cold weather worldwide, as it appears to have done during the last Grand Minimum in the 1600s? There is circumstantial evidence in the past decade that it might. We will not know, however, until it happens, and that possibility remains very uncertain.

4 comments

Polar bears are starving! (NOT)

Fake science: Two articles yesterday from the so-called science journals Nature and Science today illustrate once again how pervasive the corruption in the climate field has now spread to almost anything that relates to climate.

Both articles refer to a paper published this week in Science, though the Nature article is far more detailed and longer. Researchers had tracked 9 polar bears during the spring months in three separate years, and had found that 5 of them had lost weight during this time period. From the Nature article:

Polar bear calorie use in spring

On average, the bears needed nearly 12,325 kilocalories per day — 1.6 times more energy than previously thought. To meet such energy demands, a female bear on the spring sea ice should eat either one adult or 19 newborn ringed seals every 10 to 12 days, the scientists concluded.

But nearly half of the bears didn’t catch enough food — and were forced to fast or scavenge carcasses. These animals lost 10% of their body mass over about 10 days. “That’s dramatic,” says physiologist John Whiteman at the University of New Mexico in Albuquerque. It’s as if a person weighing 80 kilograms shed 8 kilograms in just over a week, he says.

Catching enough to eat isn’t the only challenge polar bears face. As rising temperatures thin the sea ice, wind and currents make it drift faster on the ocean surface. “Think about a treadmill,” says Merav Ben-David, a wildlife ecologist at the University of Wyoming in Laramie. If the sea ice moves faster under their paws, polar bears have to walk faster — or for longer — to remain in the same spot3, which forces them to expend more energy, she says. [emphasis mine]

Oh my god! The polar bears are dying! And global warming is killing them!

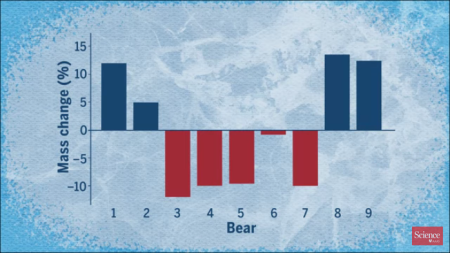
What a joke. A quick look at the graph above, captured from the Science video, reveals that what the researchers really found is that four bears lost weight, four bears gained weight, and one stayed about the same. The bears studied weren’t “starving,” they represented what looks like an ordinary cross-section of population.

Moreover, this study is incredibly uncertain in that it only studied 9 bears, and only during the spring months during three years. What happens during the rest of the year? What would happen if they studied a larger population? While the data here teaches us something about the polar bear’s diet, calorie intake and calorie requirements, it is absolutely insufficient to provide any conclusions about the future of the bear population.

Worse, while both articles were quick to mention the threat from global warming, neither mentioned that the polar bear population continues to thrive, and has been doing so for the past decade, with no declines in almost all Arctic regions.

Further compounding the bad reporting here, while both articles repeated their religious belief in global warming and the impending disappearance of the Arctic icecap, there remains zero evidence in all data gathered of the ice pack by satellites and ground research that the icecap is shrinking significantly. In fact, while it had shown a steady decline through the first decade of the 21st century, in the past few years there has been a marked recovery. While these scientists might want the ice cap to disappear for political reasons, it simply isn’t doing so.

This is junk journalism and fake science. In fact, it is downright pitiful. That the reporting at such important science journals as these has become so slipshod speaks badly for the future of science in general.

58 comments

Almost 500 science papers in 2017 challenge “global-warming consensus”

The uncertainty of science: A survey of climate papers published in 2017 shows that 485 directly challenged the so-called “consensus” that activists claim exists about global warming.

Author Kenneth Richard found that during the course of the year 2017, at least 485 scientific papers were published that in some way questioned the supposed consensus regarding the perils of human CO2 emissions or the efficacy of climate models to predict the future.

According to Richard’s analysis, the 485 new papers underscore the “significant limitations and uncertainties inherent in our understanding of climate and climate changes,” which in turn suggests that climate science is not nearly as settled as media reports and some policymakers would have people believe.

This really is not a surprise for anyone who spends even a little time reading actual climate research. If you do, you immediately realize that the absurd claims of politicians (mostly Democrats) and activists about the certainty of human-caused global warming are based on their complete ignorance of the science. Some examples:

My point isn’t to say that human-caused global warming isn’t happening. We simply don’t know. The evidence so far is very inconclusive. And for those who advocate this theory, their own models have consistently failed to match the data. Skepticism is called for, which by the way is actually the hallmark of good science.

31 comments

Sunspot update for December 2017

The precipitous decline in sunspots continues. While November 2017 remains the most inactive month for sunspots since the middle of 2009, December was a very close second.

Below is my annotated version of NOAA’s monthly update of the solar cycle, covering sunspot activity for December, which they posted on Sunday.

December 2017 Solar Cycle graph

The graph above has been modified to show the predictions of the solar science community. The green curves show the community’s two original predictions from April 2007, with half the scientists predicting a very strong maximum and half predicting a weak one. The red curve is their revised May 2009 prediction.

December 2017 sunspot record

The graph on the right, produced by SILSO (Sunspot Index and Long-term Solar Observations) on December 31, shows only 14 days during the month when there were sunspots active on the Sun’s visible hemisphere. This is only four more days then seen in November. And like November, the few sunspots were weak, resulting in tiny sunspot numbers total.

The first graph above illustrates how weak this on-going sunspot cycle has been. While the curve most closely matches the 2007 weak prediction of half the solar science community, it has one very notable difference. The actual ramp up to solar maximum started two years later than predicted, even though it appears to be ending when that prediction expected. The result is a very very short solar cycle, something that has historically always been associated with very active and intense sunspot activity. Instead, this short cycle has only seen weak activity, generally below all the predictions.

All signs continue to point to an early arrival of solar minimum. They also suggest that the next maximum will also be weak, and might even not come at all, as some solar scientists have proposed. Instead, we might be heading toward another Grand Minimum, with no significant sunspots for decades.

So, is it cold outside right now? Well, that’s weather, not climate. Nonetheless, there is a lot of circumstantial evidence that few sunspots correspond with a cooling climate on Earth. (The last grand minimum occurred in the 1600s, during what was called the Little Ice Age.) There is even some preliminary evidence to suggest that cosmic rays might be a cause. (Watch the video at the end of this link.).

Whether any of this will happen however remains unknown. We will need to wait to find out.

0 comments

More data tampering to prove global warming, this time with tidal gauges

An analysis of the adjustments made to three Indian Ocean tidal gauges suggests that this was not to correct errors but to tamper with the data to prove global warming and an accelerating rise in sea level because of it.

The authors do not mince their words. They refer to these adjustments as “highly questionable” and “suspicious.”

That’s because they can find no plausible scientific explanation for the adjustments.

The last sentence is the bottom line. At no time are such adjustments ever justified with any credible or plausible scientific evidence. They are always “arbitrary,” a word used repeatedly in the paper. And as the paper’s author’s also note,

It is always highly questionable to shift data collected in the far past without any proven new supporting material.

3 comments

The Sun goes quiet! Sunspot update for November 2017

The past month was the most inactive month for sunspots since the middle of 2009, when the last solar minimum was just ending and the Sun was beginning its ramp up to solar maximum.

NOAA on Sunday posted its monthly update of the solar cycle, covering sunspot activity for November. As I have done every month since 2010, I have posted that graph below, with annotations.

November 2017 Solar Cycle graph

The graph above has been modified to show the predictions of the solar science community. The green curves show the community’s two original predictions from April 2007, with half the scientists predicting a very strong maximum and half predicting a weak one. The red curve is their revised May 2009 prediction.

I have also added a straight yellow line near the bottom of the graph, indicating how the lack of activity this past month corresponds with the lack of activity in the summer of 2009, just when that unusually long and deep solar minimum was beginning to end.

November 2017 sunspot record

To get an idea how few sunspots were seen in November, the graph on the right, produced by SILSO (Sunspot Index and Long-term Solar Observations) on December 1, shows only 10 days during the entire month when any sunspots were active on the Sun’s visible hemisphere. And even those sunspot were few and weak, resulting in tiny sunspot numbers total.

Nor is December looking any different, with no sunspots recorded so far, four days into the month.

The plunge to solar minimum continues to appear to be happening faster than normal. At this pace, solar minimum will arrive in early 2018, making this one of the shortest solar cycles on record. That in itself would be unprecedented, as short cycles in the past have always accompanied very active solar maximums, not weak maximums like the maximum we have just seen.

I still expect the ramp down to solar minimum to slow down and stretch out to 2019, as would be more normal, but I also would not bet any money on this expectation, at this point.

The big question remains: Will the solar cycle continue as normal after this upcoming solar minimum, or will we instead see our first grand minimum since the Maunder Minimum in the 1600s, a period lasting for about a century with no obvious sunspots that also corresponded to the Little Ice Age?

7 comments

Sacrificing Scientific Skepticism

Phil Berardelli, who periodically comments here and who is a veteran science journalist who worked for the journal Science for a number of years, has written a very cogent four part essay on the subject of climate change for the think tank Capital Research Center.

Berardelli very carefully outlines the uncertainties that dominate our knowledge of the Earth’s climate, while explaining clearly why consensus is never what good science relies upon. As he notes,

Science is not primarily about proof; science is about disproof. Nothing in science, absolutely nothing, should ever be taken at face value. This view isn’t new; it’s age old.

Read it all, especially if you are one of the people who reads my writing and questions my skepticism about much of what I see in the climate field, especially coming from NASA and NOAA. Berardelli illustrates how doubt and skepticism are the hallmarks of science, and should always be honored, not denigrated with slurs like “denier.”

Full disclosure: Phil Berardelli was also my editor when I did a weekly column for UPI called Space Watch for six months in 2005.

20 comments

Physicists once again fail to detect dark matter

The uncertainty of science: The most sensitive detector yet created by physicists has once again failed to detect dark matter, casting strong doubt on all present theories for its existence.

The latest results from an experiment called XENON1T at the Gran Sasso National Laboratory in Italy, published on 30 October, continue a dry spell stretching back 30 years in the quest to nab dark-matter particles. An attempt by a Chinese team to detect the elusive stuff, the results of which were published on the same day, also came up empty-handed. Ongoing attempts by space-based telescopes, as well as at CERN, the European particle-physics laboratory near Geneva, Switzerland, have also not spotted any hints of dark-matter particles.

The findings have left researchers struggling for answers. “We do not understand how the Universe works at a deeper and more profound level than most of us care to admit,” says Stacy McGaugh, an astrophysicist at Case Western Reserve University in Cleveland, Ohio.

The process here has been a good demonstration of the scientific method. Observers detect a phenomenon that does not make sense, which in this case was that the outer regions of galaxies rotate so fast that they should fly apart. Theorists then come up with a hypothesis to explain the phenomenon, which here was dark matter, subatomic particles that have weight but do not generally interact with the rest of the universe except by their mass, which acts to hold the galaxies together. Observers than try to prove the hypothesis by finding these theorized particles.

When the particles are not found, the theorists begin to rethink their theories. Maybe dark matter does not exist. Maybe (as is mentioned near the end of the article) a rethinking of the nature of gravity itself might be necessary. Or possibly the unseen matter is not subatomic, but ordinary matter not yet detected.

If only the climate field would apply this basic scientific method to its work. There, scientists found that carbon dioxide is increasing in the atmosphere. Some theorists posited an hypothesis that said that this increase might cause the climate to warm, and created numerous (almost a hundred) models to predict this warming. After more than thirty years, however, none of those models has successfully worked. The climate has not warmed as predicted, which suggests the hypothesis is flawed, and needs rethinking. Sadly, the leaders in the climate field refuse to do this rethinking. Instead, they appear willing to adjust and change their data to make it fit, sometimes in ways that are downright fraudulent.

This is not how science is done, and it is doing a terrible disservice to both science and society in general.

25 comments

Sunspot update for October 2017

NOAA today posted its monthly update of the solar cycle, covering sunspot activity for October. That graph is posted below, with annotations.

October 2017 Solar Cycle graph

The graph above has been modified to show the predictions of the solar science community. The green curves show the community’s two original predictions from April 2007, with half the scientists predicting a very strong maximum and half predicting a weak one. The red curve is their revised May 2009 prediction.

After two straight months of rising sunspot activity, the number of sunspots plunged in October, returning the numbers almost exactly back to the general trend we have seen since 2014 when the solar maximum ended. While the short two month increase indicated that the minimum will not occur as soon as this long term trend suggests, the quick return to that trend this month suggests that it will.

Meanwhile, November is six days old and has yet to see any sunspots at all.

6 comments

Tesla stock crashes due to possible loss of tax credit

The stock of Elon Musk’s Tesla electric car company crashed this week, dropping 7% on Wednesday, with the revelation that the Republican tax plan proposes eliminating the $7,500 tax credit for buying an electric car.

Its share price fell more than seven per cent to about $296 apiece from Wednesday’s $321. The draft law emerged as the Elon-Musk-led automaker announced its worst-ever quarter, recording a $671m loss and admitting it had not met its production target for its new Model 3 car, producing just 220 of them against its 1,500 target.

Economists believe that the tax credit is a key driver for electric car sales, and cite the example of when the state of Georgia cut its $5,000 tax credit and saw sales of electric cars slump from 1,400 a month to just 100 a month in response.

What this story highlights is that electric cars are simply not economical at this time, and that the government is distorting the market by pushing them. Without government aid, practically no one would buy them.

It would be far better for everyone to let the market decide. Not only would this save us tax dollars, it would allow the industry to focus its innovative efforts on upgrades that are cost effective and profitable, rather than on pie-in-the-sky fantasies that actually do no good at all.

Hat tip Wayne DeVette for pointing me to this story.

18 comments
1 15 16 17 18 19 57