Seismic signal from recent Martian impact detected by InSight?

According to a science paper released today, a small impact that occurred about 25 miles south from the InSight lander between February 21st and April 6, 2019 might have been detected by the spacecraft’s seismometer.

From the paper’s abstract:

During this time period, three seismic events were identified in InSight data. We derive expected seismic signal characteristics and use them to evaluate each of the seismic events. However, none of them can definitively be associated with this source. Atmospheric perturbations are generally expected to be generated during impacts; however, in this case, no signal could be identified as related to the known impact. Using scaling relationships based on the terrestrial and lunar analogs and numerical modeling, we predict the amplitude, peak frequency, and duration of the seismic signal that would have emanated from this impact. The predicted amplitude falls near the lowest levels of the measured seismometer noise for the predicted frequency. Hence it is not surprising this impact event was not positively identified in the seismic data.

Based on this data, they now think they will only be able to detect about two impacts per year with InSight’s seismometer, a decrease from the previous estimate of as many as ten.

Martian acne?

Acne on Mars?
Click for full image.

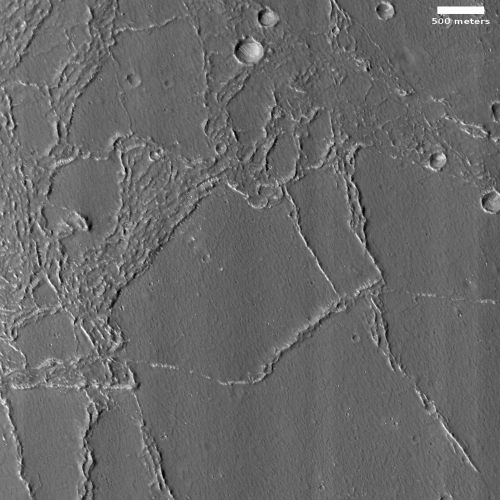
Cool image time! The photo to the right, rotated, cropped, and reduced to post here, shows what the scientists from the high resolution camera on Mars Reconnaissance Orbiter (MRO) label “fretted terrain.” In an earlier post describing evidence found by Europe’s Mars Express orbiter of glaciers in the northern mid-latitudes of Mars, fretted terrain was described as follows:

As is common with fretted terrain, it contains a mix of cliffs, canyons, scarps, steep-sided and flat-topped mounds (mesa), furrows, fractured ridges and more, a selection of which can be seen dotted across the frame.

These features were created as flowing material dissected the area, cutting through the existing landscape and carving out a web of winding channels. In the case of Deuteronilus Mensae, flowing ice is the most likely culprit. Scientists believe that this terrain has experienced extensive past glacial activity across numerous martian epochs.

In that case the fretted terrain was in the transition zone between the northern lowland plains and the southern cratered highlands, and actually resembled chaos terrain. What we see here looks far different, a surface that resembles the bubbly surface of a vat of thick molten stew.

This image is also deep in the cratered southern highlands, though still in the mid-latitudes at 41 degrees south latitude. While the presence of ice close to the surface is possible at this latitude and could definitely explain what this image shows, it would be a big mistake to accept this explanation without skepticism. A lot is going on here, and much of it suggests volcanic-type processes. The volcanoes might have been spewing mud or ice instead of molten lava, but then again, all is uncertain.

What is certain is that I can’t help thinking of the pock-marked skin of an adolescent teenager when I look at this photo. And for all we know, the processes that produce both surfaces could be in many ways similar.

Fake BBC report: Population to crash by end of century

Global fertility rate since 1950

No one is gonna be born! According to this garbage BBC report of a even more vapid science paper, the on-going decline in the fertility rate will cause the world’s population by the end of the century to shrink by about a billion, with some countries losing half their populations.

Falling fertility rates mean nearly every country could have shrinking populations by the end of the century. And 23 nations – including Spain and Japan – are expected to see their populations halve by 2100. Countries will also age dramatically, with as many people turning 80 as there are being born.

What is going on? The fertility rate – the average number of children a woman gives birth to – is falling. If the number falls below approximately 2.1, then the size of the population starts to fall. In 1950, women were having an average of 4.7 children in their lifetime.

Researchers at the University of Washington’s Institute for Health Metrics and Evaluation showed the global fertility rate nearly halved to 2.4 in 2017 – and their study, published in the Lancet, projects it will fall below 1.7 by 2100. As a result, the researchers expect the number of people on the planet to peak at 9.7 billion around 2064, before falling down to 8.8 billion by the end of the century. [emphasis mine]

The key word in the quote is highlighted. It is also illustrated in the graph above, taken from the BBC article but annotated by me to indicate the time period in red where we have absolutely no data at all, and no one really knows anything. While the decline in fertility since the 1960 is well documented, caused by prosperity and greater choices for women worldwide, the projections beyond 2017 are not worth the money that the Bill & Melinda Gates Foundation paid for it. Those projections are based on models, and from what I can tell, those models are more opinion that anything. We really can’t predict what is going to happen, because the factors that have caused the fertility decline in the past half century might simply not apply in the next eighty years.

In fact, based on the completely unexpected disaster that occurred this year because of the Wuhan virus panic and the possible fundamental changes, for the worse, that this panic will likely bring to worldwide culture, the prosperity that fueled the fertility drop in the past half century might vanish, bringing about changes that make any projections into the future pure guesswork.

In fact, these models are probably as useless and as wrong as the models used to predict that millions would die from COVID-19 in the first year. In fact, this model is likely comparable to most scientific models that attempt to predict the future. You have a better shot at guessing what will happen by looking at tea leaves.

The sad thing is that the BBC is still reporting on a model like this as if it were real data, and therefore must happen. You’d think they’d learn.

Thousands of scientists and doctors condemn COVID-19 panic

Censensus! Since May literally thousands of scientists and doctors, including a Nobel Prize winner, have publicly condemned the heavy-handed lockdowns and restrictions on freedom imposed by governments because of its panic over COVID-19.

The article provides details. It is very clear that a very large number of scientists are appalled by the over-reach by government health officials that has led to the shut downs and the requirements for mask use. (Obviously these scientists are all white supremacists and racists, and should be cancelled immediately!)

The article also led me to this research from Oxford University, which concluded in April that the death rate from the Wuhan virus is just about the same as the flu:

Taking account of historical experience, trends in the data, increased number of infections in the population at largest, and potential impact of misclassification of deaths gives a presumed estimate for the COVID-19 IFR somewhere between 0.1% and 0.41%.

The website states that they update regularly when new data arrives, but it appears that since April nothing has caused them to revise this conclusion. The first link above also notes that Dr. Anthony Fauci of the CDC agreed with this conclusion in a peer-reviewed March article for the New England Journal of Medicine. (Obviously Oxford and Fauci are white supremacists and racists also, and should be silenced forthwith!)

We should stop this madness and go back to normal. Our government has failed us so completely in its response to COVID-19 it should be fired completely. And that includes every single one of the health officials who pushed for lockdowns, mask rules, and social distancing.

Monument Valley on Mars

Monument Valley on Mars
Click for full image.

Today’s cool image is located near the Martian equator, in the middle of Arabia Terra, the most extensive region of the transition zone between the low northern plains and the southern cratered highlands. Taken on May 9, 2020 by the high resolution camera on Mars Reconnaissance Orbiter (MRO) and cropped to post here, the photo shows some layered mesas surrounded by a terraced and scalloped terrain with dust filling the low spots.

This is likely to be a very dry place on Mars. At only 2 degrees north of the equator, the evidence so far suggests that if there is a buried ice table (like the water table on Earth), it will be much deeper than at higher latitudes. The terrain reflects this, looking reminiscent of Monument Valley in the American southwest. In fact, the satellite image below, which I grabbed from MapQuest, shows a typical mesa in Monument Valley.
» Read more

Martian swirls and curlicues

glacial features in depression on Mars
Click for full image.

Cool image time! The photo to the right, cropped and reduced to post here, is a great example of how a well known geological process on Earth, glaciers, can form features on Mars that appear most inexplicable.

The image was taken on May 13, 2020 and highlights the geology found in a depression, likely an eroded crater, on the northwest flanks of one of Mars’ largest basins, Argyre Planitia, located in the planet’s southern cratered highlands. The basin is thought to have been formed by a giant impact during the Late Heavy Bombardment around 3.9 billion years ago, when the inner terrestrial planets were sweeping up the last remnants of the Sun’s accretion disk, with that process causing the many craters we see on the Moon, Mercury, and Mars

This particular depression is at 41 degrees south latitude, in the mid-latitudes where scientists have found much evidence of buried glaciers. This is likely what we are looking at here. The section I’ve cropped has a dip to the south, which somewhat fits these flow features. If you look at the full image, you will see comparably weird flow features south of this section, flowing downhill in the opposite direction, to the north.

The problem is that not all the features fit the direction of flow, or any flow at all. I suspect we are seeing evidence of the waxing and waning of glaciers over this terrain over many eons. Disentangling that history however is confounding, especially when we are limited to only studying such objects from orbit.

I must also add that this image was labeled by the MRO science team a “terrain sample,” which means it wasn’t specifically requested by any scientist studying this geology. Instead, they needed to take an image to maintain the spacecraft’s camera temperature, and picked this spot for that snapshot. Their choice wasn’t random, but it also wasn’t based on any focused research.

Comet Neowise: NOW is the time to go see it

Comet Neowise is now visible each evening just after sunset. This article shows a bunch of images produced by people worldwide.

The comet will not be back for thousands of years, so this will be your only chance to see it. And usually good evening-view comets occur only once every few decades, usually not more than once or thrice every century. If you want to see a comet in all its glory, Comet Neowise is giving you a chance, and now is the time to look.

Midnight repost: The think tank culture of Washington

The tenth anniversary retrospective of Behind the Black continues: The essay below, first posted on June 22, 2016, was the result of a Washington DC. trip, occurring during the heat of the presidential campaign just after Donald Trump had become the Republican candidate for president.

The impression I got of the Washington culture then has sadly proven more accurate than I would have ever guessed. And their response to Trump’s election was just as I feared.

———————————-
The Think Tank Culture of Washington

On Monday I attended and gave a presentation at the one-day annual conference of the Center for New American Security (CNAS) in Washington, D.C., in conjunction with the space policy paper I am writing for them, Exploring Space in the 21st Century.

CNAS was founded ten years ago by two political Washington insiders, one a Democrat and the other a Republican, with a focus on foreign policy and defense issues and the central goal of encouraging bi-partisan discussion. For this reason their policy papers cover a wide range of foreign policy subjects, written by authors from both political parties. The conference itself probably had about 1,000 attendees from across the political spectrum, most of whom seemed to me to be part of the Washington establishment of policy makers, either working for elected officials, for various executive agencies, or for one of the capital’s many think tanks, including CNAS.

I myself was definitely not a major presenter at this conference, with speakers like Vice President Joe Biden, Senator Lindsey Graham (R-South Carolina), and Senator Joe Reed (D-Rhode Island). I was part of a panel during one of the lunch breakout sessions, where approximately one third of the attendees came to have lunch while we spoke about space. I only had ten minutes to speak, and used that time to outline (1) the influence SpaceX is having on the entire launch industry and (2) the vast differences in cost, development time, and results between the Orion/SLS program and commercial space. Not surprisingly, the aerospace people from the big established companies appeared to be somewhat uncomfortable with what I had to say, though the Airbus people liked it when I made it clear I thought that the U.S. should allow foreign companies to compete for American business, including government launches.

Their discomfort was best illustrated by the one question asked of me following my talk, where the questioner said that I was comparing apples to oranges in comparing a manned capsule like Orion, intended to go beyond Earth orbit, with the unmanned cargo capsules like Dragon and Cygnus, that only go to ISS. I countered that though I recognized these differences, I also recognized that the differences were really not as much as the industry likes to imply, as demonstrated for example by SpaceX’s announcement that they plan to send Dragon capsules to Mars beginning in 2018. After all, a capsule is still only a capsule. The differences simply did not explain the gigantic differences in cost and development time.

I added that Orion compares badly with Apollo as well, noting that Apollo took about a third as long to build and actually cost less. I doubt I satisfied this individual’s objections, but in the end I think future policy will be decided based on results, not the desires of any one industry bigwig. And in this area Orion/SLS has some serious problems. I hope when my policy paper is released in August it will have some influence in determining that future policy.

My overall impression of CNAS, the speakers, and the people who attended was somewhat mixed. Having lived in the Washington, D.C. area from 1998 to 2011, when I attended many such conferences, I found that things haven’t changed much in the last five years. Superficially, everyone was dressed in formal business suits (something you see less and less elsewhere), and they also got to eat some fancy food at lunch.

On a deeper level my impressions were also mixed.
» Read more

Problems at Europa Clipper

NASA has fired the project scientist for one overbudget and behind schedule instrument on Europa Clipper, and restructured work on a second instrument for similar reasons.

“We’ve been struggling on cost growth on Clipper for some time,” said Curt Niebur, program scientist for the mission at NASA Headquarters. “Overall, we’ve been largely successful in dealing with it, but late last fall, it became clear that there were three instruments that experiencing some continued and worrisome cost growth.”

The outcome of the reviews, he said, could have ranged from making no changes to the instruments to, in a worst-case scenario, terminating the instruments. The leadership of NASA’s Science Mission Directive recently decided to keep all three instruments, at least for now.

The fired scientist had been in charge of the mass spectrometer. At the moment they have installed a temporary replacement, and have put the instrument team on notice that it now has a very low priority. Should it fall further behind in schedule or budget it could easily be terminated.

The spacecraft’s imaging system also has schedule and budgeting problems, so much so that NASA was considering dropping the wide field camera, leaving Europa Clipper with only a narrow field camera. Right now both have been retained, but the wide field camera might still be dropped if costs continue to rise.

Midnight repost: Al Gore and the silencing of debate

The Behind the Black tenth anniversary retrospective: Today’s repost is from August 29, 2011, and was one of my earliest essays describing the real meaning of the scientific method.

——————————–
Al Gore and the silencing of debate

Yesterday I posted a link to a story about Al Gore claiming that any expression of skepticism about global warming is to him no different than racism. Here again is what Gore said,

“There came a time when friends or people you work with or people you were in clubs with — you’re much younger than me so you didn’t have to go through this personally — but there came a time when racist comments would come up in the course of the conversation and in years past they were just natural. Then there came a time when people would say, ‘Hey, man why do you talk that way, I mean that is wrong. I don’t go for that so don’t talk that way around me. I just don’t believe that.’ That happened in millions of conversations and slowly the conversation was won. We have to win the conversation on climate.”

More than at any other time, Gore here has very successfully illustrated the differences between how climate skeptics debate the scientific questions of climate change versus how global warming advocates do it.
» Read more

A great hike to do on Mars!

Knife Mesa at the exit from Kasei Valles
Click for full image.

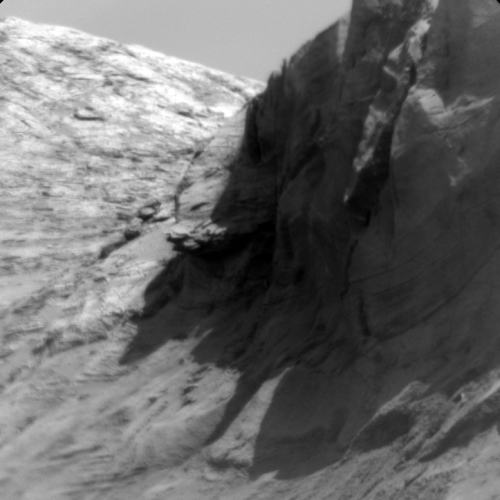
Time to take a cool image and go sight-seeing. The photo to the right, cropped and reduced to post here, was taken by the high resolution camera on Mars Reconnaissance Orbiter (MRO) on May 25, 2020, and shows a spectacular knife-edge mesa, its cliffs more than 650 feet high on either side.

This knife mesa sits among a bunch of similar mesas, and appears to be in a region that could be called chaos terrain, formed by flowing water or ice along faults, cutting criss-crossing canyons with mesas between.

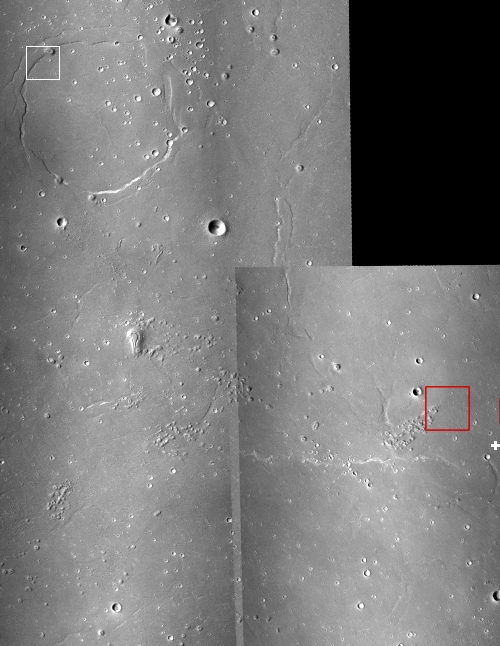
This mesa points east out from the Kasei Valley, the second largest canyon draining out from the Tharsis Bulge that contains Mars’ largest volcanoes. The overview map below provides some context, with the white cross indicating the location of today’s cool image.
» Read more

Solar Orbiter operational, first images to be released

Engineers have now confirmed that Solar Orbiter, having completed its first close fly-by of the Sun, is working perfectly and is producing images and data better than expected.

They will release to the public the first images on July 16.

“The first images are exceeding our expectations,” says Daniel Müller, Solar Orbiter Project Scientist at ESA. “We can already see hints of very interesting phenomena that we have not been able to observe in detail before. The 10 instruments on board Solar Orbiter work beautifully, and together provide a holistic view of the Sun and the solar wind. This makes us confident that Solar Orbiter will help us answer profound open questions about the Sun.”

No other images of the Sun have been taken from such a close distance. During its first perihelion, the point in the spacecraft’s elliptical orbit closest to the Sun, Solar Orbiter got as close as 77 million kilometres from the star’s surface, about half the distance between the Sun and Earth. The spacecraft will eventually make much closer approaches to the Sun. The spacecraft is now in its cruise phase, gradually adjusting its orbit around the Sun. Once in its science phase, which will commence in late 2021, the spacecraft will get as close as 42 million kilometres from the Sun’s surface, closer than the planet Mercury. The spacecraft’s operators will gradually tilt Solar Orbiter’s orbit to enable the probe to get the first proper view of the Sun’s poles.

A previous spacecraft, Ulysses, flew over the Sun’s poles, but it did it from far away, and was designed not to take images but to study the Sun’s solar wind. Solar Orbiter is getting in close.

Midnight repost: Mars!

The tenth anniversary retrospective of Behind the Black continues: Despite my many essays on culture and politics, Behind the Black remains mostly a site reporting on space and science. Since the modern exploration of Mars is probably the most significant on-going event now in space, it seemed unsatisfactory to only repost one or two of my past articles on this subject, when I have probably have posted hundreds. Instead, this midnight repost will provide links to a bunch, divided into several topics.

Martian geology, shown in cool images

First, we have the many cool images I have posted on Mars, often tied to detailed descriptions of what scientists are now beginning to learn about the red planet’s mysterious geological history. The following are the most important, and will help readers better understand future cool images.

Future colonization

Next, two posts, both focused on the future exploration and colonization of Mars.
» Read more

Spring at the Martian South Pole

Geysers on Mars?
Click for full image.

Geysers on Mars
Click for full image.

It is now full spring at the Martian south pole, and as should be expected much has been happening there. Like the Martian north pole, when sunlight arrives after the dark winter it hits the seasonally-placed mantle or cap of carbon dioxide snow and begins to melt it, in the alien ways things like this occur on Mars.

The two images to the right illustrate this process for one particular place located in what are called the south polar layered deposits. The two images, just released on July 1, 2020 from the high resolution camera on Mars Reconnaissance Orbiter (MRO) and taken on May 14 and May 30 respectively, had immediately caught my attention because they were labeled “Active Geyser Locale Dubbed Macclesfield.” Active geysers?! I immediately contacted Candy Hansen of the Planetary Science Institute in Tucson, Arizona, whom I correctly guessed had requested these photos. She explained,

The name for this site is of course informal, and it dates back to when I first started picking sites to monitor. I was so certain we would see active geysers here! We see their deposits, the fans on the surface, but so far we have not caught an actual eruption in progress.

The overview map of the south pole below provides some context.
» Read more

Results from Yutu-2 determine “gel-like” rocks are impact melt

Chinese scientists have now published their analysis of the “gel-like” rocks seen by China’s Yutu-2 lunar rover back in October 2019, and have concluded that they are glasses produced from melt occurring during an impact.

The authors describe the material as a dark greenish and glistening impact melt breccia, measuring 20 inches by 6 inches (52 by 16 centimeters). These features are signs of possible presence of glasses, which are usually sourced from impact melts or from volcanic eruptions.

According to the paper, the breccia — broken fragment of minerals cemented together — was formed by impact-generated welding, cementing and agglutinating of lunar regolith and breccia. The material, they say, resembles lunar impact melt breccia samples returned by NASA’s Apollo missions. In particular, similarities with the Apollo samples designated 15466 and 70019 are noted, a comparison made earlier by lunar scientist Clive Neal at the University of Notre Dame. Sample 70019, collected by astronaut and trained geologist Harrison “Jack” Schmitt, is made of dark, broken fragments of minerals cemented together and black, shiny glass.

The results are not definitive, however. The paper notes that the analysis is limited by the fact that VNIS measurements were taken under bad illumination conditions and other factors.

This conclusion is not surprising, as the rover has been traveling through a region dominated by impact ejecta.

InSight’s mole is bouncing again

Plan of action for InSight's mole

The engineering team for InSight’s German-built digging tool, dubbed the mole, yesterday reported that it is once again no longer driving into the ground.

Previously they had been able to make progress by having InSight’s scoop press down on the mole. Once the top of the mole however was below ground, the scoop could no longer provide that support, and at that point the mole began bouncing again with each hammer-stroke, the surrounding Martian dirt unable to provide the friction to hold the mole down.

As shown by the illustration above, they are now going to try using the scoop to fill the hole and then use the scoop to press down on the dirt, with the hope this will provide the structural friction required to hold the mole in place after each hammer stroke. This effort will take time, and will prevent the scoop from doing its other work. They are therefore taking a pause until August before beginning the hole-filling operation.

Rover update: Curiosity’s future journey

Mount Sharp, with Curiosity's future travels
Click for full image.

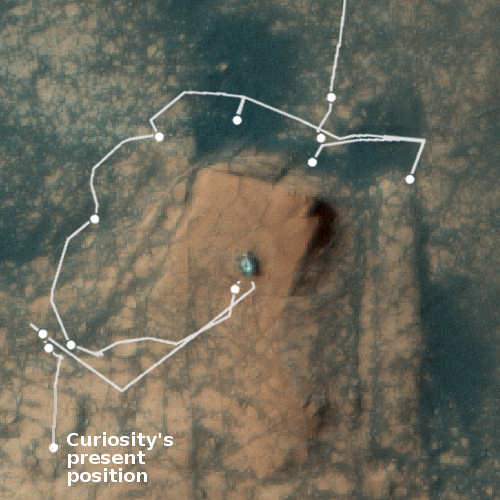
[For the overall context of Curiosity’s travels, see my March 2016 post, Pinpointing Curiosity’s location in Gale Crater. For the updates in 2018 go here. For a full list of updates before February 8, 2018, go here.]

Today the science team of Curiosity issued a press release outlining their travel plans for the rover over the next year. In conjunction, they also released a mosaic of 116 images taken by the rover showing that route, a reduced in resolution version shown above.

The rover’s next stop is a part of the mountain called the “sulfate-bearing unit.” Sulfates, like gypsum and Epsom salts, usually form around water as it evaporates, and they are yet another clue to how the climate and prospects for life changed nearly 3 billion years ago.

But between the rover and those sulfates lies a vast patch of sand that Curiosity must drive around to avoid getting stuck. Hence the mile-long road trip: Rover planners, who are commanding Curiosity from home rather than their offices at NASA’s Jet Propulsion Laboratory in Southern California, expect to reach the area in early fall, although the science team could decide to stop along the way to drill a sample or study any surprises they come across.

Overview map sol 2804 of Curiosity's route

This journey actually began in late May, at about the time of my last rover update. The overview map to the right shows in red their approximate planned route to avoid that large dune field to the south. The meandering yellow line indicates Curiosity’s actual route. The straight yellow lines indicates I think the area covered by the mosaic above. As you can see, since the end of May they have quickly returned to their planned route. Note also that the dune field extends about twice the distance beyond the eastern edge of this overview map.

The next big goal when they reach that sulfate-bearing unit will be to not only study it but to also study a recurring slope lineae on the slopes of that unit, a streak that darkens and lightens seasonally that might be caused by seeping brine from below. Because the sulfate unit and the linneae are both major geological goals, they are going to be moving fast to get there. I am sure they will periodically stop to do geology, but I think the travel will be, as it has been for the past month, quick-paced.

Once the rover gets to the sulfate unit, Curiosity will at last have actually reached the base of Mount Sharp. Up until now it has been traveling first in the surrounding plains, then in the mountain’s foothills. The terrain will get much rougher and be far more spectacular, as Curiosity will be entering canyons as it begins to climb the mountain itself.

Sunspot update: More evidence of an upcoming weak maximum

On July 4th NOAA updated its monthly graph tracking the monthly activity of sunspots on the Sun’s visible hemisphere. Below is that updated graph, annotated by me to show the past and new solar cycle predictions.

June 2020 sunspot activity

The graph above has been modified to show the predictions of the solar science community for both the previous and upcoming solar maximums. The green curves show the community’s two original predictions from April 2007 for the previous maximum, with half the scientists predicting a very strong maximum and half predicting a weak one. The blue curve is their revised May 2009 prediction. The red curve is the new prediction, first posted by NOAA in April 2020.

June saw an uptick of activity since my last update, though that activity remains quite low. We saw two sunspots during the month, both with polarities that link them to the next maximum and thus providing evidence that we will have a maximum in about five or six years. The first of those sunspots was also one of the strongest new cycle sunspots yet seen, and lasted for almost two weeks before it rotated off the visible face of the sun.

The ratio of next cycle sunspots vs sunspots from the past maximum has also been shifting. More and more, the new sunspots belong to the next cycle and less to the last. The ramp up to the next maximum is definitely beginning, though to call it a “ramp up” at this point is a big exaggeration. Sunspot activity remains low, though the last few months have seen some activity, unlike the seven months of nothing seen during the second half of last year.

The upcoming prediction for the next maximum calls for it to be very weak. Interestingly, the activity in June surpassed that prediction. This does not mean that the prediction will be wrong, only that June was more active when compared to the smooth prediction curve. As the cycle unfolds the monthly numbers will fluctuate up and down, as they did last cycle. The question will be whether their overall numbers will match closely with the prediction. In the past cycle actual sunspot activity was consistently below all predictions. It is too soon to say how well the new prediction is doing.

It appears we will have a comet show in July!

After two other comets this spring suggested they might become bright naked eye objects and then fizzled, it now appears that Comet NEOWISE will deliver, having survived its closest approach to the Sun to now brighten towards first magnitude.

For the northern hemisphere, this is what to expect if you wish to see it:

In the morning sky, the first views of NEOWISE could come as early as July 5 or 6 in the morning sky, very low above the northeast horizon. By around July 11, the comet will reach an altitude of nearly 10 degrees — for comparison, 10 degrees is roughly equal to the width of your fist held at arm’s length. Then over the next 10 days it will gradually slide back down toward the north-northeast horizon, eventually disappearing from dawn visibility.

A far-better viewing perspective will become available in the evening sky starting around July 12, when it will appear low in the northwest sky. In the evenings to follow, the comet will rapidly climb higher in the sky.

On July 22, NEOWISE will make its closest approach to the Earth, a distance of 64 million miles (103 million km). By July 25, the comet will appear 30 degrees (“three fists”) up from the west-northwest horizon as darkness falls. And on July 30-31st, the comet will be passing just to the north of the fine star cluster of Coma Berenices or Berenice’s Hair.

Will this comet brighten more to become comparable to glorious Comet Hale-Bopp in 1997? Keep your fingers crossed.

Midnight repost: The Fantasy of Extreme Weather

The tenth anniversary retrospective of Behind the Black continues: The science described in this essay, posted originally on April 11, 2013 remains even today entirely accurate. Worse, the story illustrates the exact same kind of obtuse refusal to deal with reality that has put us today in the midst of a panic over a relatively minor seasonal virus.

Unfortunately, the links to the first two articles that I reference no longer work.

—————————–
The Fantasy of Extreme Weather

This week there were three stories describing new research proving that global warming is going to cause an increase in the number and violence of extreme weather events. Each was published in one of the world’s three most important scientific journals.

Sounds gloomy, doesn’t it? Not only will extreme heatwaves, cold waves, and droughts tear apart the very fabric of society, you will not be able to drink your soda in peace on your next airplane ride!

However, one little detail, buried in one of these stories as a single sentence, literally makes hogwash out of everything else said in these three articles.
» Read more

A hanging crater on Mars

Hanging crater
Click for full image.

Overview

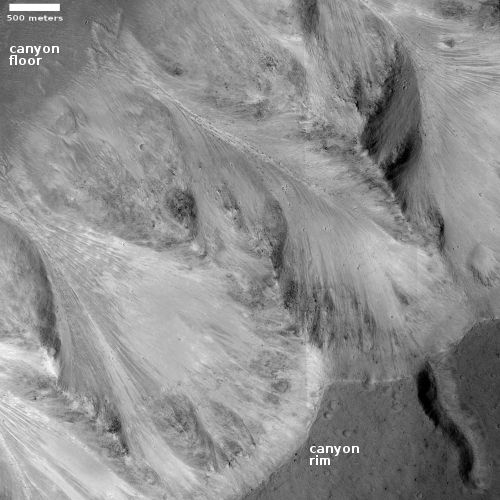
Cool image time! The image to the right, cropped and reduced to post here, was taken by Mars Reconnaissance Orbiter (MRO) on May 1, 2020, and shows a truly intriguing crater that they dub a “Crater Hanging on Mesa Wall.”

Located in Deuteronilus Mensae, a chaos region of mesas and cross-crossing canyons in the transition zone between the northern lowland plains and the southern cratered highlands, the crater literally overhangs the edge of this canyon’s cliff. The overview map to the right, with this location indicated by the red box, illustrates what this region’s geology is like.

The most likely explanation is that the impact occurred prior to the creation of the canyon, and when the canyon eroded, the material in and of this crater was more resistant, probably because the impact had packed it together to increase its density.

At the same time, the features inside both craters in the photo, as well as below them on the floor of the canyon, suggest the presence of buried glaciers, something not unlikely at the 45 degree north latitude where this crater sits.

So, here’s a guess at the geological history. First we had the impact, then during the eons of glacial ebb and flow on Mars due to wide swings in the planet’s obliquity (its rotational tilt), the canyon was cut, with that erosion leaving the crater sitting high above the canyon floor below it.

One more curious detail: The material in the canyon seems asymmetric, suggesting that the crater actually dips down toward the canyon, as if it as a unit has tilted to the east as the canyon was worn out below it.

New storm outbreak on Jupiter

Clyde's Spot
Click for full image.

A new storm, dubbed Clyde’s spot after its discoverer, developed suddenly in late May on Jupiter, and has been imaged by Juno during its most recent close fly-by of the gas giant planet.

The image to the right, cropped to post here, focuses in on this spot. It is the feature in the center of the full image, with the Great Red Spot to the upper left.

The new feature was discovered by amateur astronomer Clyde Foster of Centurion, South Africa. Early on the morning of May 31, 2020, while imaging Jupiter with his telescope, Foster noticed a new spot, which appeared bright as seen through a filter sensitive to wavelengths of light where methane gas in Jupiter’s atmosphere has strong absorption. The spot was not visible in images captured just hours earlier by astronomers in Australia.

On June 2, 2020, just two days after Clyde Foster’s observations, Juno performed its 27th close flyby of Jupiter. The spacecraft can only image a relatively thin slice of Jupiter’s cloud tops during each pass. Although Juno would not be travelling directly over the outbreak, the track was close enough that the mission team determined the spacecraft would obtain a detailed view of the new feature, which has been informally dubbed “Clyde’s Spot.”

The feature is a plume of cloud material erupting above the upper cloud layers of the Jovian atmosphere. These powerful convective “outbreaks” occasionally erupt in this latitude band, known as the South Temperate Belt

The coolest thing about this is that the storm was spotted by an amateur, using a ground-based telescope, within hours of its inception.

China announces target launch date for its Tianwen-1 Mars rover

The new colonial movement: According to a new report out of Singapore, China has set July 20-25 as the launch window for its Mars orbiter/lander/rover mission, dubbed Tianwen-1.

Should they meet this date, it means they will launch before Perseverance, arriving at Mars about the same time, in February 2021. And like Perseverance, this launch window closes this summer, and if they can’t meet it they will have to wait two years.

Midnight repost: Behind the Black

In celebration of the tenth anniversary the Behind the Black, I will each evening at midnight this month repost an earlier essay or article posted on the website sometime during the past ten years. Since I have posted more than 22,000 times since I started this website in July of 2010, I have plenty of good stuff to choose from. The thirty reposts over the next month will highlight some of the best.

We begin with what is really the only Easter Egg on Behind the Black, as it has sat as a unheralded link dubbed only Behind the Black on the main page since the website’s beginning. That link takes you to the following essay, excerpted and adapted from the final afterword in the paperback edition of my book about the Hubble Space Telescope, The Universe in a Mirror.

It explains much about my goals in all that I write.
————————————
Behind the Black

At the end of the last spacewalk during this last servicing mission to Hubble, astronaut John Grunsfeld took a few moments to reflect on Hubble’s importance. This was Grunsfeld’s third spaceflight and eighth spacewalk to Hubble, and no one had been more passionate or dedicated in his effort to get all of Hubble’s repairs and upgrades completed.

“As Arthur C. Clarke says,” Grunsfeld said, “the only way of finding the limits of the possible is by going beyond them into the impossible.”

For most of human history, the range of each person’s experience was of a distant and unreachable horizon. This untouchable horizon defined “the limits of the possible.” No matter how far an individual traveled, there was always a forever receding horizon line of unknown territory tantalizingly out of reach before him.
» Read more

Two wedding cakes on Mars

Tall wedding cake on Mars
Click for full image.

It it time for two cool Martian images from the high resolution camera on Mars Reconnaissance Orbiter (MRO). Though both show features that are similar and likely had some comparable geological origins, they are located in two very different places on Mars and thus also had very different histories.

What makes them fun is how much both resemble classic tall wedding cakes, though the second has unfortunately fallen down and is no longer eatable.

The first, cropped on the right to post here, was taken on May 18, 2020, and is described by the science team as a “Tall Layered Mesa in Crater in Deuteronilus Mensae.” Deuteronilus Mensae is in the transition zone between the northern lowland plains and the southern cratered highlands, and being in the high mid-latitudes (42 degrees north) shows a lot of evidence of buried and eroded glaciers. Many of these glaciers are found inside craters.

What caused this layered mesa however to form is beyond me. It is taller than the crater in which it sits, as well as the surrounding terrain. A glacier would settle into the lowest regions, and would not last if exposed above the rim like this is. Its height suggests that the surrounding terrain was once much higher, and has been eroded away. Yet if so, why does this mesa also sit inside a depression?

The second “wedding cake” is even more intriguing, though less baffling.
» Read more

Perseverance launch delayed to July 30, 2020

Not good: Because of an issue with the Atlas 5 rocket, NASA and ULA have decided to delay again the launch of the next Mars rover Perseverance from July 22nd to July 30th.

“Due to launch vehicle processing delays in preparation for spacecraft mate operations, NASA and United Launch Alliance have moved the first launch attempt of the Mars 2020 mission to no earlier than July 30,” NASA said. “A liquid oxygen sensor line presented off-nominal data during the Wet Dress Rehearsal, and additional time is needed for the team to inspect and evaluate.”

ULA performed the Wet Dress Rehearsal on June 22. The exercise involved rolling the Perseverance rover’s Atlas 5 launcher out of its vertical integration hangar to Cape Canaveral’s Complex 41 launch pad, then loading the rocket with kerosene, liquid hydrogen, and liquid oxygen propellants. The launch team practiced countdown procedures, testing the Atlas 5’s systems before halting the pre-launch sequence seconds before ignition of the rocket’s RD-180 main engine.

Their official launch window extends to August 11th, though they could still launch as late as August 15th and get to their landing site in Jezero Crater on Mars.

This is the third delay. The first involved a faulty crane and the second contamination issues in the rover’s clean room. Now an issue with an oxygen sensor. Let us hope their are no more, and that the weather then cooperates. It they don’t launch by August 15th the launch will then be postponed for two whole years.

Calling this exoplanet alien is an understatement

Worlds without end: Using the space telescope TESS astronomers have determined that one of the hottest exoplanets known, with surface temperatures as much as 7,800 degrees Fahrenheit (hotter than our Sun), is even stranger than expected.

Not only does the exoplanet have a polar orbit around its star, that star rotates so fast that its equator bulges out, actually making its poles as much as 1,500 degrees F hotter than the equator.

With each orbit, KELT-9 b twice experiences the full range of stellar temperatures, producing what amounts to a peculiar seasonal sequence. The planet experiences “summer” when it swings over each hot pole and “winter” when it passes over the star’s cooler midsection. So KELT-9 b experiences two summers and two winters every year, with each season about nine hours.

The star, about 670 light years away, is thought to be twice as massive as the Sun, with the exoplanet having a mass 2.9 times that of Jupiter. Whether it is a gas giant like Jupiter or has an atmosphere is entirely unknown. At these temperatures the situation is so alien we really only know the orbit and approximate range of temperatures.

Giant dark starspots explain Betelgeuse’s dimming last year

Astronomers now think that unusually large dark starspots on the face of the red supergiant star Betelgeuse caused its dimming from October 2019 to April 2020.

“Corresponding high-resolution images of Betelgeuse from December 2019 show areas of varying brightness. Together with our result, this is a clear indication of huge star spots covering between 50% and 70% of the visible surface and having a lower temperature than the brighter photosphere,” said co-author Peter Scicluna from the European Southern Observatory (Eso).

“For comparison, a typical sunspot is the size of the Earth. The Betelgeuse star spot would be a hundred times larger than the Sun. The sudden fading of Betelgeuse does not mean it is going supernova. It is a supergiant star growing a super-sized star spot.” said co-author Prof Albert Zijlstra from The University of Manchester, UK

Starspots have been identified on the surface of Betelgeuse previously, so what is interesting here is how large these spots were.

A minor rill on the Moon

Kathleen, a rill on the Moon
Click for full image.

Cool image time! The image above, reduced to post here, is a colorized digital terrain model produced from Lunar Reconnaissance Orbiter (LRO) data. On top of the original mosaic of photos the LRO science team has overlaid the elevation data obtained by LRO’s laser altimeter. It shows a tadpole shaped pit dubbed Kathleen, with its tail trailing off to the southeast. As they note:

Kathleen is a pyroclastic vent with a sinuous rille (colloquially known as Rima Mozart [Not IAU confirmed]) that extends from the southeast end of the vent. Rilles are large channels formed by sustained channelized lava flows. This vent is a great location to investigate ancient volcanism on the Moon.

The elevation data reveals one interesting feature: The lowest part of the vent pit is not at its western end, where one would think at first glance, based on the general dip that produced the rill flowing to the east. That the lowest point is at the widest section of the pit instead suggests that this pit no longer looks as it did when it was venting. In the almost four billion years since it is thought all volcanic activity here ceased, there has been plenty of time for the slow erosion processes on the Moon, caused by radiation, micrometeorites, and the solar wind, to partly fill this pit and round out its cliff walls.

The two overview maps below provide some context.
» Read more

Some quick and easy evidence proving masks are unhealthy

The video below illustrates very simply and quickly the reasons masks are generally a bad idea, especially for anyone with any chronic respiratory disease that causes reduced lung function. What it shows that within your mask the levels of oxygen are routinely below OSHA’s recommendations. While a healthy person will not suffer significantly, wearing a mask for a long period of time will certainly lead to headaches and diminished function. For a person with asthma or chronic pulmonary disease the low levels of oxygen, combined with the higher levels of CO2 (which you are rebreathing) will eventually cause serious harm.

The video comes from this link, which includes similar demonstrations.

Wearing a mask is simply not supported by the science. There is no clear evidence it stops or even slows the spread of the Wuhan virus, and it carries with it negative medical consequences.

The negative social consequences need not be discussed. They are beyond counting.

1 87 88 89 90 91 271