Sunspot update: The most sunspots since 2014

Time for my monthly sunspot update, based on NOAA’s monthly graph that tracks the number of sunspots on the Sun’s Earth-facing hemisphere. The newest graph, with December’s numbers added to the timeline, is below. As always, I have added some additional details to provide context.

In December the half-year pause in the ramp up to solar maximum ceased, with the Sun seeing the most sunspots since September 2014. This high activity far exceeded the predicted sunspot count for December 2023, almost doubling it. In fact, December’s sunspot count almost equaled the predicted peak for the upcoming solar maximum, which is not supposed to happen until sometime in 2025.

» Read more

27 comments

SpaceX launches oceanography satellite

SpaceX early this morning used its Falcon 9 rocket to successfully launch an oceanography satellite, dubbed SWOT, for both NASA and France’s space agency CNES.

The satellite it designed to measure the height of water on 90% of the Earth’s surface.

The first stage was making its sixth flight, and successfully returned to Earth, touching down on its landing pad at Vandenberg Space Force Base.

The leaders in the 2022 launch race:

59 China
57 SpaceX
21 Russia
9 Rocket Lab
8 ULA

The U.S. now leads China 81 to 59 in the national rankings, but trails the entire world combined 91 to 81.

These numbers however should change again later today, as SpaceX has another launch scheduled.

0 comments

NOAA once again over-predicts the hurricane count

As it has done repeatedly in recent years, NOAA in 2022 once again over-predicted the hurricane count for this past hurricane season, predicting an above-normal season when it actually ended up to be well below-normal.

In late May and again in early August 2022 NOAA predicted that the year 2022 Atlantic Hurricane Season (between June to end November calendar period) would be an “above normal” season with 14-21 named storms, between 6-10 hurricanes including 3-6 major hurricanes (Category 3,4 and 5) as shown in NOAA’s diagram below.

Colorado State University’s Department of Atmospheric Science/Tropical Meteorology Project has compiled the year 2022 tropical storm data, establishing that, compared to its 30 year North Atlantic data records covering the Climatological period 1991-2020, the year 2022 hurricane season was below average in Named Storms, Named Storm Days, Hurricane Days, Major Hurricanes, Major Hurricane Days and Accumulated Cyclone Energy (ACE).

The many graphs at the link also demonstrate that the predictions that there will be an increase in extreme weather events due to increased use of fossil fuels is also proving false.

4 comments

Sunspot update: The Sun’s unprecedented pause to maximum continues

It is the beginning of the month, and NOAA has once again published its update of its monthly graph that tracks the number of sunspots on the Sun’s Earth-facing hemisphere. Below is the newest graph, adding November’s numbers to the timeline and annotated by me with some additional details added to provide context.

Sunspot activity dropped in November, though still remained significantly higher than the prediction, a sunspot number of 77.6 compared to the predicted number of 57.4. At 77.6, the Sun continues the pause that began in June in the ramp up to solar maximum. For the past half year the Sun’s sunspot output has essentially stalled at approximately the same level.

» Read more

13 comments

Not one climate model predicts global temperature; all predict too much warming

Climate models versus actual observations for the past 50 years

Even as we wait for the final results in numerous elections yesterday, I thought I would throw the chart to the right out for my readers to digest.

The chart was created by climate scientist Roy Spencer of the University of Alabama, who has also been one of the principal investigators for one of NASA climate satellites.

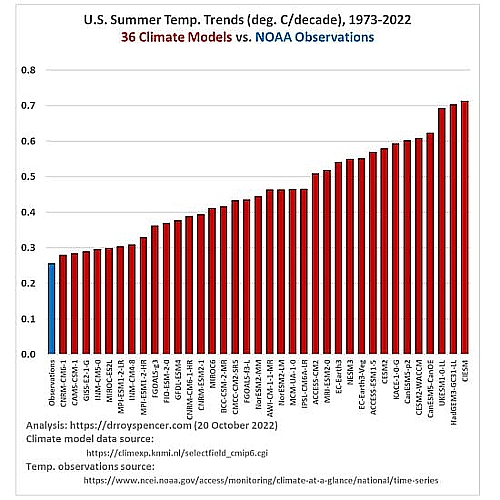
As seen in the accompanying plot, 50-year (1973-2022) summer (June/July/August) temperature trends for the contiguous 48 U.S. states from 36 CMIP-6 climate model experiments average nearly twice the warming rate as observed by the NOAA climate division dataset.

…The official NOAA observations produce a 50-year summer temperature trend of +0.26 C/decade for the U.S., while the model trends range from +0.28 to +0.71 C/decade.

Not one climate model predicted the actual global temperature for the past half century. All predicted too much warming, with about half the models predicting twice as much warming as actually occurred.

In other words, the models continue to express opinion, not science. To rely on any model for establishing climate policy is not only foolish, it is downright irresponsible.

But don’t worry. Joe Biden and the Democrats are on their game, and will shut down all fossil fuel energy sources, because it simply feels right to them.

Meanwhile, on a related side note, the fact that it is no longer possible to finish counting the votes on election day — something that Americans did routinely for more than two centuries long before computers — either is another sign that serious election tampering is going on, or is a clear demonstration that we have entered the new dark age, where it will no longer be possible to accomplish some of the most basic tasks of a true civilization.

In either case, the barbarians rule, and we all suffer because of it.

17 comments

Sunspot update: The pause in the ramp up to solar maximum continues

NOAA has once again published its monthly update of its monthly graph that tracks the number of sunspots on the Sun’s Earth-facing hemisphere. Below is that November graph, annotated by me with some additional details added to provide context.

Though sunspot number continued to be much higher than the prediction (almost double), October saw almost exactly the same number of sunspots as seen in September, which is why this new graph seems almost identical to last month’s.

In other words, the pause in the ramp up to solar maximum, first noted in August, continues.
» Read more

4 comments

Deadly climate change on Mars!

Junk science! A new computer simulation by scientists now proposes that there was microscopic life on Mars billions of years ago, but its existence served to destroy the climate and kill all life!

The press appears to be eating this story up, with enthusiasm. From the New Atlas story above:

Humans might not be the first lifeforms in the solar system to face the threat of their own activity changing the climate of their home planet. A new model suggests that ancient Mars was once habitable enough to support methane-producing microbes, and they may have wiped themselves out by causing irreparable damage to the Red Planet’s atmosphere. [emphasis mine]

A Space.com story is written better, but it still jumps on the bandwagon:
» Read more

6 comments

Sunspot update: Activity again exceeds prediction but ramp up pauses

NOAA this weekend published, as it does at the start of every month, its October update of its monthly graph that tracks the number of sunspots on the Sun’s Earth-facing hemisphere. As I have done since I started this website in 2011, I have published that graph below, with some additional details added to provide context.

An increase in sunspot activity in September wiped out the decline seen in August, so that the sunspot number in September once again matched or exceeded the numbers seen during the middle of the previous solar maximum from 2012 to 2014, a low period of activity between that maximum’s two peaks. Activity also continued to exceed the predictions of the panel of government solar scientists put together by NOAA.

At the same time, since May the ramp up to maximum has stalled, something I noted last month and has now become more evident.
» Read more

7 comments

Sunspot update: Solar activity continues to exceed sunspot predictions

It is the beginning of September and time to post another update on the Sun’s ongoing solar cycle. Below is NOAA’s monthly graph tracking the number of sunspots on the Sun’s Earth-facing hemisphere, with the activity in August now added. I have also added some additional details to the graph to give the numbers a larger context.

Though sunspot activity dropped in August it remained significantly above the predictions of the panel of government solar scientists put together by NOAA. The predicted sunspot number for August, as indicated by the red curve, was supposed to be about 48. The actual number was 75.

» Read more

4 comments

Sunspot update: Activity recovers mostly from last month’s decline

It is the start of the month, and thus time to post NOAA’s monthly update of its graph tracking the number of sunspots on the Sun’s Earth-facing hemisphere. That graph is below, with some additional details added by me to provide a larger context.

After the first real decline in sunspot activity in June, the Sun recovered that decline almost completely in July. Though the ramp up to solar maximum has stalled somewhat in the last two months, the trend continues to point to a very active maximum, much higher than predicted as well as much stronger than the last very weak maximum in 2020.

» Read more

2 comments

Sunspot update: For the first time in 2022, sunspot activity eases

With the year half over, the Sun in June did something it had not done since the start of the year: The number of sunspots seen daily on the Sun’s visible hemisphere actually declined from the month before.

I know this because, as I do every month, I have posted below NOAA’s monthly update of its graph tracking the number of sunspots on the Sun’s Earth-facing hemisphere, with some addition details added to provide a larger context.

» Read more

1 comment

Scientists claim rocket launches are going to damage ozone layer

Junk science: This week NOAA government scientists published a paper claiming that the upcoming increase in rocket launches worldwide is a threat to the ozone layer and will also — my heart be still — promote climate change!

The study found that a tenfold increase in the amount of soot injected into the stratosphere every year would after 50 years lead to an annual temperature increase in that layer of 1 to 4 degrees Fahrenheit (0.5 to 2 degrees Celsius). The stratosphere is the layer of the atmosphere just above the lowest troposphere. The study found that the projected warming would slow down subtropical jet streams, bands of strong wind circling the planet at the lower edge of the stratosphere that influence the African and Indian summer monsoons.

Warmer temperatures in the stratosphere would also degrade the protective ozone layer, which blocks harmful ultraviolet radiation from the sun from reaching the planet’s surface.

The paper’s abstract also said this:

We show that the rocket black carbon increases stratospheric temperatures and changes the global circulation, both of which cause a reduction in the total ozone column, mainly in the northern high latitudes. Comparing the amplitude of the atmospheric response using different emission rates provides insight into stratospheric adjustment and feedback mechanisms. Our results show that the stratosphere is sensitive to relatively modest black carbon injections.

This is garbage science, and I wouldn’t bother posting a link to it if other news sources weren’t promoting it. These predictions — based on a very simple computer model — are nothing more than guesses, and are apparently designed to both attack the growing space industry as well as garner funding for more such junk science, as illustrated by this quote from the NOAA press release:

“We need to learn more about the potential impact of hydrocarbon-burning engines on the stratosphere and on the climate at the surface of the Earth,” said lead author Christopher Maloney, a CIRES research scientist working in NOAA’s Chemical Sciences Laboratory. “With further research, we should be able to better understand the relative impacts of different rocket types on climate and ozone.”

For almost a half century climate scientists — many working for government agencies like NASA and NOAA — have been publishing junk papers like this, predicting climate doom in only a few decades unless we do as they say, while funneling boatloads of cash into their pockets. Almost none of those predictions have turned out to be correct.

This report is equally suspect, especially because it touts the false statistic that “launch rates have tripled in recent decades.” The number of launches has not tripled from its long-term average since Sputnik. The only way you can get manufacture that fake statistic is if you compare last year’s total (134) with the launch numbers from the early 1960s, before the space race had even begun. And while the launch numbers are likely to rise dramatically in the coming years, the numbers will still be infinitesimal compared to other industries. Going from 50-100 launches to 200-500 launches is hardly the end of the world.

It really is far past time for the press and the general public to stop listening to these fake papers.

19 comments
1 3 4 5 6 7 57