Flying over Jupiter

Cool movie time! Using images produced by Juno in orbit around Jupiter, citizen scientist Kevin Gill has produced a very nice movie of the spacecraft’s 27th fly-by on June 2, 2020.

During the closest approach of this pass, the Juno spacecraft came within approximately 2,100 miles (3,400 kilometers) of Jupiter’s cloud tops. At that point, Jupiter’s powerful gravity accelerated the spacecraft to tremendous speed — about 130,000 mph (209,000 kilometers per hour) relative to the planet.

I have embedded the movie below the fold. The choice of a piece of music by Vangellis might seem hokey, but I think in this case it works very nicely. I also was impressed with the addition of some 3D depth near the movie’s beginning.
» Read more

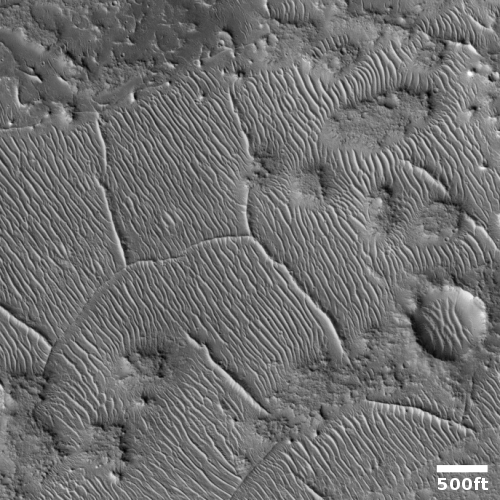
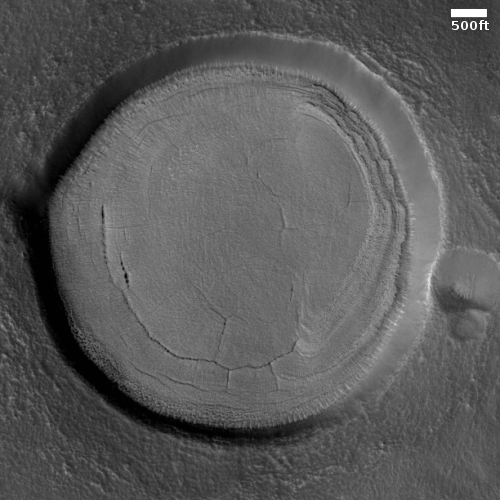
A typical mid-latitude Martian crater with glacial features

Typical mid-latitude Martian crater with glacial fill
Click for full image.

Cool image time! The crater on the right, the image cropped and reduced to post here, is a great example of many craters scientists have found in the mid-latitudes on Mars containing a variety of features that suggest buried glaciers. In this case we are looking at what they have dubbed a concentric crater fill, material that resembles glacial material that fills the crater’s interior and floor, and appears often to erode in a series of rings. You can see another example here.

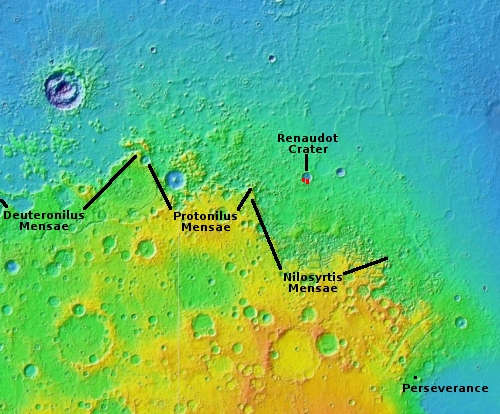
The photo was taken on June 29, 2020 by the high resolution camera on Mars Reconnaissance Orbiter (MRO). The crater itself is located in a region of chaos terrain dubbed Nilosyrtis Mensae, located in the transition zone between the cratered southern highlands and the lowland northern plains.

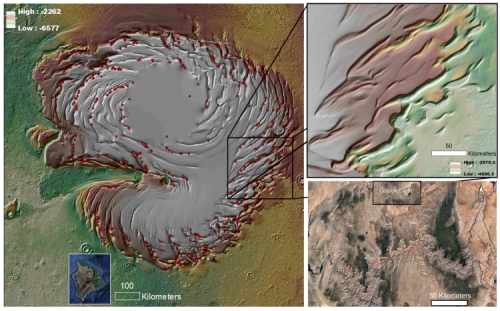
Nilosyrtis Mensae is part of a region of Mars I call glacier country. When you include the mensae regions Protonilus and Deuteronilus to the west, this transition zone of random mesas, knobs, and criss-crossing canyons stretches about 2,000 miles. The context map below focuses in on Nilosyrtis Mensae, where this crater is located.
» Read more

Radio astronomers claim negative impact from satellite constellations

Put them on the Moon! Radio astronomers have released a paper claiming that the coming large communication satellite constellations, such as Starlink and OneWeb, will seriously impact observations with the Square Kilometer Array (SKA) of radio telescopes being built in the remote western outback of Australia.

Saturation of the instruments: very strong interfering signals can saturate the receiver systems and thereby drown out all other signals seen by the Band 5b receivers. As a consequence, all data in that frequency band would be lost, rendering these receivers useless for a portion of the time. For the first phase of the constellation deployments (about 6,400 satellites in total), saturation is predicted to occur for a few percent of the time assuming there is no direct illumination of the dishes by the satellites. For significantly larger constellation sizes (up to more than 100,000 satellites), saturation would be essentially continuous without significant mitigation measures implemented by the satellite operators.

Based on this conclusion, the astronomers estimate that for observations in this particular band they will need to look about 70% longer to get the same data, thereby cutting the number of observations by about half.

The astronomers propose this solution:

One of these mitigation techniques is for the satellite transmitters not to point their beams near the SKAO dishes. SKAO would require operators to steer their satellites’ beams away from the telescope site, a measure which would require a simple software modification with no repercussion on the constellation’s deployment, positioning or hardware. While a cost-effective implementation of this solution does depend on the hardware and software deployed on the satellites, operators already use this technique to comply with international regulations when their satellites cross the path between geostationary satellites in higher orbit and their receiving ground stations, for example to avoid affecting telecommunications and TV transmissions.

This mitigation could reduce the impact on the SKA by a factor of 10 over that noted previously and result in a 7% increase of integration time for SKA observations within the satellite transmission range 4. While any loss of sensitivity is regrettable, SKAO recognises the need for compromise between the competing scientific and commercial drivers.

The solution seems reasonable, but in truth it is only a temporary one. The permanent and smart solution for the astronomical community is to move their telescopes, in all wavelengths, off the Earth. For radio astronomy the far side of the Moon would be ideal.

And with SpaceX now developing a reusable big rocket, Starship, to put such payloads in orbit at low cost, the astronomers need to start thinking about taking advantage of this engineering. The situation for ground-based astronomer will only get worse.

China releases images of Tianwen-1 on way to Mars

Tianwen-1 on its way to Mars

China has released several images taken of its Tianwen-1 orbiter/lander/rover by a camera ejected by the spacecraft on its way to Mars.

The images released by the China National Space Administration on Oct. 1 show the Tianwen 1 spacecraft traveling through the blackness of space. Tianwen deployed a small camera to take the self-portrait as it tumbled away from the mothership.

Two wide-angle lenses on the deployable camera were programmed to one image every second. The images were transmitted back to Tianwen via a wireless radio link, then downlinked back to ground teams in China.

In the images, Tianwen 1’s solar array wings and dish-shaped high-gain communications antenna are prominently visible. The white section of the spacecraft is the mission’s entry module and heat shield, which contains a Chinese rover designed to land on Mars and explore the surface.

The spacecraft is about halfway to Mars, and will arrive in Mars orbit in February. It will then spend several months surveying its candidate landing sites, of which there appear to be two, before releasing the lander/rover to the surface.

Cliffs of Martian ice

southern hemisphere Martian ice scarp
Click for full image.

Today’s cool image to the right, cropped to post here, shows an ice scarp located in the high southern latitudes south of Hellas Basin. It was taken on August 15, 2020 by the high resolution camera on Mars Reconnaissance Orbiter (MRO), and was released today as a captioned image. From the caption:

Scientists have come to realize that, just below the surface, about one third of Mars is covered in ice. We study this ice to learn about Mars’ ancient climate and astronauts’ future water supplies.

Sometimes we see the buried ice because cliffs form like the one in this image. On the brownish, dusty cliff wall, the faint light-blue-colored ice shows through. [emphasis mine]

This ice scarp is one of about two dozen [pdf] that have so far been found within the latitude bands of approximately 45 to 65 degrees latitude in both the north and south hemispheres. The data so far obtained suggests that the scarp exists because of a pure water ice layer just below the surface. Over time this pole-facing cliff retreats away from the pole towards the equator, leaving behind it an extended pit. In the cliff wall scientists think they have detected evidence of that water ice layer.

Blue in MRO hi-res images can indicate both water as well as very rough surfaces. While much of the blue here could be ether, the blocky cracks suggest it is ice. As explained by Colin Dundas of the U.S. Geological Survey’s Astrogeology Science Center in Arizona and lead author of the pdf above,

The crack patterns are likely thermal contraction cracks, which form in shallowly buried ice due to seasonal temperature changes causing it to expand and contract. When that repeats over many years it creates regular patterns of cracks that organize themselves into polygons.

The overview image below gives the location of all known such scarps, as of March of 2020, taken from the pdf paper that I linked to above.
» Read more

Two dozen exoplanets superior to Earth for life?

The uncertainty of science: A team of scientists have now identified 24 exoplanets from the Kepler telescope archive that they propse might actually be better for life than Earth itself.

All the exoplanets are rocky and terrestrial, like the Earth. All are in the habitable zone, meaning that they orbit their star at a distance that makes their general temperature comparable to Earth.

What makes them superior, according to these scientists, are three factors. First, their stars are not G-type stars, like the Sun, but K-types. K-types have much longer lifespans, 70 billion years compared to the Sun’s 8 to 10 billion, allowing more time for life to develop.

Second, the planets have a slightly greater mass than Earth.

Part of the reason the Earth is habitable is because it’s large enough to be geologically active, giving it a protective magnetic field, and has enough gravity to retain an atmosphere. According to the team, if a planet was 10 percent larger, it would have more surface area to live on. If it was 1.5 times as massive as the Earth, its interior would retain more heat from radioactive decay, would remain active longer, and hold onto its atmosphere for a longer time.

Finally, the orbits of these two dozen exoplanets makes them just slighter warmer than Earth, which is thought to be beneficial to life.

This is interesting, but it is pure guesswork. These factors might make our Earth life happier, but these scientists have no idea if such conditions are beneficial or harmful to the creation of life. At present we have zero data on what the ideal conditions would be.

“N-Word Science” Proves You’re a Racist!

Link here. The author delves into the so-called “science” of some of the most hyped “white supremacy” academic research, and finds it not only wanting, he finds it downright garbage and not worth the recycled paper it is written on.

No surprise. Race and gender studies are all lies and bigotry, designed not to improve the knowledge of the human race, but to slander all whites, to dehumanize them, and to make it justifiable to treat them as second-class citizens.

I liked his opening however:

With summer 2020 finally in the rearview mirror, and after seven months of “two weeks to flatten the curve,” I’m getting a little sick of “the science.” Not science, mind you, but theee science, the thing that leftists keep assuring us exists—a singular, canonical truth we all must obey. Mind you, it sure seems like there’s not a great deal of agreement about “the science” regarding COVID: You don’t need masks/You do need masks. Hydroxychloroquine doesn’t work/Hydroxychloroquine totally works. Sunlight doesn’t help/Sunlight helps. COVID doesn’t linger in the air/COVID totally lingers in the air/COVID doesn’t linger after all.

Large crowds spread COVID/Large crowds don’t spread COVID (if it’s a BLM crowd).

Theee science is whatever today’s CNN home page says it is. If that happens to contradict yesterday’s home page, well, that’s your fault for having a memory. [emphasis in original]

The number of lies and inconsistencies coming from the “We’re all gonna die from COVID-19” crowd is legion. In this one short quote he sums the worst up quite succinctly.

Criss-crossing Martian ridges hit by new impacts

Criss-crossing Martian ridges hit by new impacts
Click for full image.

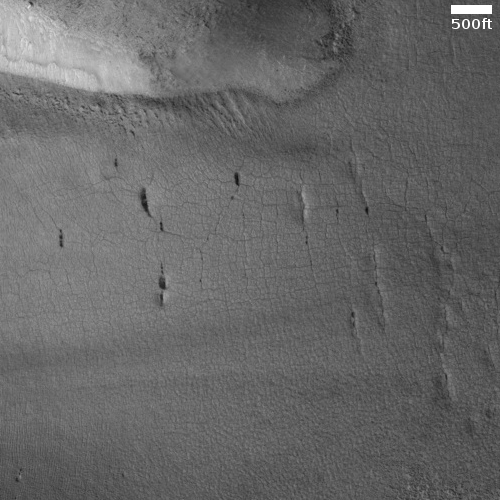
The image to the right, cropped to post here, is a captioned photo from the high resolution camera on Mars Reconnaissance orbiter and released today. From the caption:

The black spots [recent impacts] form because the craters exposed cleaner materials in the subsurface beneath the bright, dusty surface.

Our image is also interesting because the surface has a criss-cross pattern formed by wind activity. Bright ripples that are oriented from the upper right to the lower left are perpendicular to the wind flow. In contrast, outcrops that have been eroded by the wind are oriented perpendicular to the ripples to produce the criss-cross pattern we now observe.

The overview map below might also help explain this criss-cross pattern.
» Read more

A donut on the Moon

A donut crater on the Moon
Click for full image.

In this case the donut is a crater dubbed Bell E Crater, with a second concentric rim in its interior. The photo to the right, reduced to post here, was taken by Lunar Reconnaissance Orbiter (LRO) as part of its high resolution survey of the entire Moon. As noted at the first link:

Craters not only vary in shape but also in complexity. There are simple craters and complex craters with ring structures and mountains at the center. Somewhere in between is Bell E, a small crater located within the larger Bell crater. These donut-shaped formations are commonly known as concentric craters. Many questions remain on the origin of donut craters. While there have been several ideas about their origin, including double impacts, the currently favored hypotheses involve volcanic processes and compositional variations.

The article outlines four hypotheses for explaining this crater’s formation, a perfectly aligned double impact, ripples at impact into thick warm lava, layers of different densities, and later volcanic activity. None do a good job of explaining all of the concentric craters found on the Moon, and thus suggest that these craters might have formed from some combination of more than one theory.

Sunspot update: Practically no sunspots for a month

It is sunspot update time again! NOAA today updated its monthly graph for tracking the Sun’s monthly sunspot activity, and I have posted it below, with additional annotations by me to show the past solar cycle predictions.

July and August had seen sunspot numbers higher than the new NOAA prediction (shown by the red curve on the graph below). September however was almost totally blank, with only two weak sunspots for the entire month, as shown on the SILSO graph below.
» Read more

Hubble creates time lapse movie of fading supernova

Using the Hubble Space Telescope, astronomers have created a time lapse movie showing the fading of a supernova in a nearby galaxy over a year.

The supernova is captured by Hubble in exquisite detail within this galaxy in the left portion of the image. It appears as a very bright star located on the outer edge of one of its beautiful swirling spiral arms. This new and unique time-lapse of Hubble images created by the ESA/Hubble team shows the once bright supernova initially outshining the brightest stars in the galaxy, before fading into obscurity during the year of observations. This time-lapse consists of observations taken over the course of one year, from February 2018 to February 2019.

The video of that time lapse is embedded below the fold.

The galaxy itself is located 70 million light years away. That the supernova of this single star initially outshone the entire galaxy indicates the almost unimaginable power of the explosion.
» Read more

Parker completes record-setting sixth Sun fly-by

The Parker Solar Probe has successfully completed its sixth close fly-by of the Sun, flying as close as 8.4 million miles, the closest any spacecraft has ever gotten to the Sun, while also moving at a record speed of 289,927 miles per hour.

Flight controllers at the Johns Hopkins Applied Physics Laboratory in Laurel, Maryland, received a “Status A” signal from the spacecraft through NASA’s Deep Space Network at 4:45 a.m. EDT; Status A is the best of four possible status signals, and indicates that the spacecraft is operating nominally.

The beacon comes after a six-day stretch when communications with the spacecraft were not possible as it wheeled around the Sun. This is the first sign of a successful solar encounter; this sixth solar encounter began Sept. 21 and continues through Oct. 2.

Future fly-bys will likely break this record as well.

On the rim of Mars’ Grand Canyon

The rim of Valles Marineris
Click for full image.

Cool image time! Mars has many grand geological features that will surely attract tourists in the far future, when the planet has been successfully colonized and humans live there with the same ease that we today live in what was the New World wilderness several hundred years ago.

Of those features, none probably compare with Valles Marineris, the largest known canyon in the solar system. When compared to it, the Grand Canyon — at about a mile deep, about ten miles wide, and about 280 miles long — is a mere pothole, hardly noticeable. Valles Marineris averages a depth of five miles, a width of 370 miles, and a length of 1,900 miles. You could fit many Grand Canyons within it.

The photo to the right, cropped to post here, was taken on July 13, 2020 by the high resolution camera on Mars Reconnaissance Orbiter (MRO). It shows only a tiny section of this gigantic canyon’s rim. At this spot the depth from rim to floor is about 4.3 miles, or about 22,700 feet. In the image itself I estimate the cliff at the rim to be somewhere between 6,000 to 8,000 feet high, more than the depth of the entire Grand Canyon. And that’s only this top cliff.

The three overview maps below show the context of this location within Valles Marineris.
» Read more

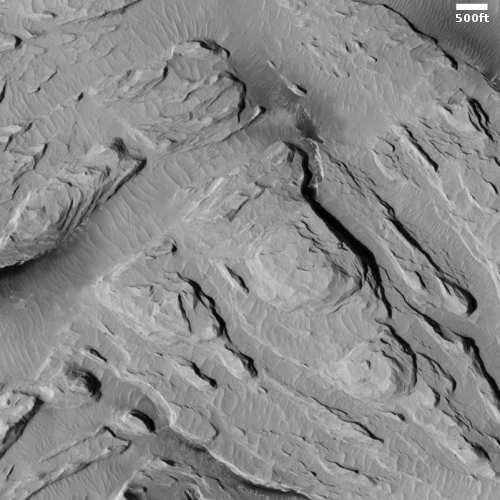
Big scallops in the Martian southern latitudes

Big scallops on Mars
Click for full image.

Cool image time! The photo to the right, rotated, cropped, and reduced to post here, shows an example of some large scalloped depressions in the high southern latitudes of Mars.

Taken by the high resolution camera on Mars Reconnaissance Orbiter (MRO) on June 27, 2020, these scallops resemble in many ways the ice scarps that scientists have previously found at this same latitude, both to the east and west of where these scallops are located. With those scarps, the data suggests that a very pure layer of ice is visible in the cliff face, and that over time the cliff retreats northward due to sublimation of that ice.

The scallops in the photo to the right suggest the same process, though the differences raise questions. As explained by Colin Dundas of the U.S. Geological Survey’s Astrogeology Science Center in Arizona,
» Read more

The liquids in Titan’s lakes stratify into different density layers

Using the data archive from the Cassini mission to Saturn, scientists now think that the liquids in Titan’s lakes can stratify into different density layers.

Lakes on Saturn’s moon Titan, composed of methane, ethane, and nitrogen rather than water, experience density driven stratification, forming layers similar to lakes on Earth. However, whereas lakes on Earth stratify in response to temperature, Titan’s lakes stratify solely due to the strange chemical interactions between its surface liquids and atmosphere, says a paper by Planetary Science Institute Research Scientist Jordan Steckloff.

Stratification occurs when different parts of a lake have different densities, with the less dense layer floating atop the denser layer. On Earth, lakes in temperate climates often stratify into layers in the summer as the Sun heats the surface of the lake, causing this water to expand and become less dense, forming a layer of warm water that literally floats upon the cooler water below. This density-driven stratification can occur on Titan as well; however it happens due to the amount of atmospheric nitrogen that Titan’s surface liquids can dissolve, rather than the liquids warming up and expanding.

…Because liquid methane is less dense than liquid ethane, it has been long assumed that Titan’s methane would generally float atop its liquid ethane. However, when methane’s affinity for atmospheric nitrogen is accounted for, methane can dissolve sufficient nitrogen at low temperatures to become denser than ethane.

This result has a great deal of uncertainty, mostly because of the relatively small dataset available of Titan. What it really shows is the possibility of this phenomenon. To confirm it will require some in situ measurements.

UAE leader confirms goal to land rover on Moon by ’24

The new colonial movement: The ruler of the United Arab Emirates (UAE) has confirmed the initiation of a project to land a rover on the Moon by 2024, and have it built entirely by UAE engineers.

The Emirates Lunar Mission will be a 100 percent Emirati-built lunar rover that will land on the moon by 2024, according to a series of tweets by Sheikh Mohammed bin Rashid Al Maktoum, the UAE Prime Minister and Vice President and Ruler of Dubai.

The lunar rover has been named “Rashid” in honour of Sheikh Rashid bin Saeed Al Maktoum who ruled Dubai for 32 years from 1958 until his death in 1990 and who “sparked” the emirate’s advancement.

This is an ambitious goal, but not completely unreasonable. Their engineers were closely involved in the construction of their Hope Mars orbiter, mostly built by U.S. universities and subcontractors. That knowledge can now be applied to their own spacecraft. I also suspect that their 2016 agreement with India to invest billions there in exchange for space-related engineering assistance included technical information about India’s own lunar rover missions.

New study confirms liquid water under Mars’ south pole

A new study has confirmed earlier work that suggested there were liquid lakes of water under the Martian south pole.

The data appears to indicate that the bodies are “hypersaline solutions” –a brine in which high concentrations of salt are dissolved in water – which is perhaps the reason they are able to stay liquid despite the very cold conditions of Mars’s south pole.

The fact that there is a whole set of lakes suggests that they have probably formed relatively easily, and that versions of them may therefore have been present throughout the history of the planet. [emphasis mine]

There is one problem with hypothesis indicated by the highlighted words. Mars’ rotational tilt (its obliquity) shifts significantly, from 0 to 60 degrees. Right now it is tilted about 25 degrees, similar to Earth. The south pole as we see it today will have been very different at different obliquities, which means there is no way to assume these posited underground lakes would have been there.

Martian channels formed by water? by ice? by lava?

Meandering channels on Mars
Click for full image.

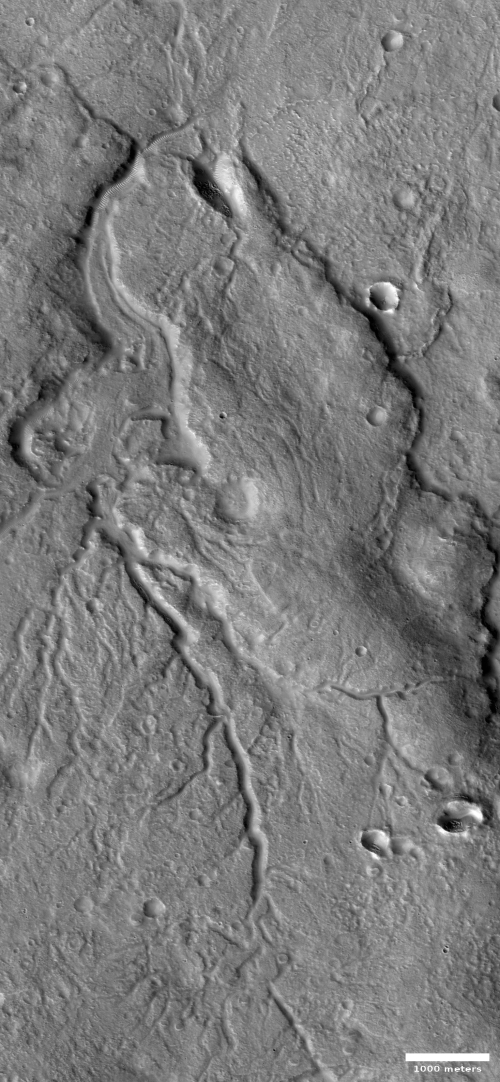
Many of the pictures from Mars show meandering channels, all of which suggest an erosion process related to some form of flow. For most of the last half century, since the first images of these channels were beamed back by Mariner 9 in 1972, scientists had believed that liquid water must have caused them. The accumulating recent photos from Mars now tentatively suggest that these channels might have instead been caused by glacial processes, creeping frozen water instead of liquid.

The image to the right, rotated, cropped, and reduced to post here, was taken on July 17, 2020 by the high resolution camera on Mars Reconnaissance Orbiter. The channels suggest some form of flow going downhill to the northwest, but was it caused by water or ice? There is no obvious visual evidence of glaciers in this image, nor is there any such evidence that I can spot in any of the nearby high resolution images of this same region, despite the fact that at 35 degrees north latitude it is in the mid-latitude band where scientists have identified many glacial features.

The region itself is called Mareotis Fossae, an area of southwest-to-northeast trending parallel fissures and ridges, as shown in the two overview maps below.
» Read more

German instrument on Chang’e-4 documents dangerous radiation levels

This result is not a surprise: A German instrument on China’s Chang’e-4 lander, located now on the Moon’s far side, has measured the radiation levels there, and found them to be much worse than found on Earth.

DLR radiation physicist Thomas Berger from the DLR Institute of Aerospace Medicine, who participated in the publication explains: “The radiation exposure we measured is a good indication of the radiation inside a spacesuit. The measurements give us an equivalent dose rate – the biologically weighted radiation dose per unit of time – of around 60 microsieverts per hour. For comparison, during a long-haul flight from Frankfurt to New York, the dose rate is five to 10 times lower than this. On Earth’s surface, it is some 200 times lower. In other words, a long-term stay on the Moon will expose astronauts’ bodies to high doses of radiation.”

“Human bodies are simply not made to be exposed to space radiation,” adds Robert Wimmer-Schweingruber of the Christian-Albrecht University (CAU) in Kiel, whose team developed and built the LND instrument . “On longer missions to the Moon, astronauts will have to protect themselves from it – by covering their habitat with a thick layer of lunar rock, for example. This could reduce the risk of cancer and other illnesses caused by long periods of time spent on the Moon.”

Previous instruments had only measured the cumulative radiation for the entire mission. This instrument took multiple readings lasting one, ten, or sixty minutes, which gives a more realistic measure of what an astronaut would actually experience, once there.

An ice-covered mountain on Mars?

Ice-covered mountain on Mars?
Click for full image.

Grinnell Crater in Glacier National Park in 2017

Today’s cool image, taken on July 1, 2020 by the high resolution camera on Mars Reconnaissance Orbiter, is of a mound-like mountain on Mars that to all intents and purposes appears covered by glacial ice, some eroded, some not.

The image to the right, rotated, cropped, and reduced to post here, shows this mound. Both the flow coming down from the mountain top down the north slope as well as the flow in the north that appears to begin in a small crater suggest glacial features.

Even more convincing are what appear to be patches of glacial ice on the southern slopes, resembling the kind of glacial patches you see everywhere in Glacial National Park. The second photo to the right, taken by me on our visit to Glacier National Park in 2017, shows similar patches hugging the mountainside at Grinnell Glacier.

This Martian mountain is located in the southern hemisphere inside Hellas Basin on its eastern interior rim. (See the overview map below, with the location of this photo the small white box south of Harmakhis Valles.) Thus, you would expect the north-facing slope to get more sunlight (and more heat) than the south-facing slopes. Yet, from this image there appears to be greater erosion on the south-facing slopes. A puzzle indeed.
» Read more

OSIRIS-REx team confirms date for sample grab from Bennu

Nightingale landing site on Bennu
Click for full image.

The OSIRIS-REx science team has confirmed October 20, 2020 as the date the spacecraft will attempt a sample grab from the asteroid Bennu.

OSIRIS-REx is charged with collecting at least 2 oz. (60 grams) of Bennu’s rocky material to deliver back to Earth – the largest sample return from space since the Apollo program – and the mission developed two methods to verify that this sample collection occurred. On Oct. 22, OSIRIS-REx’s SamCam camera will capture images of the TAGSAM head to see whether it contains Bennu’s surface material. The spacecraft will also perform a spin maneuver on Oct. 24 to determine the mass of collected material. If these measures show successful collection, the decision will be made to place the sample in the Sample Return Capsule (SRC) for return to Earth. If sufficient sample has not been collected from [the primary landing site] Nightingale, the spacecraft has onboard nitrogen charges for two more attempts. A TAG attempt at the back-up Osprey site would be made no earlier than January 2021.

The press release at the link provides a lot of technical and interesting details about the sample-grab-and-go attempt, expected to put the spacecraft in contact with the asteroid’s surface for no more than sixteen seconds.

The maneuver itself is quite risky, as the available smooth landing area, as shown in the image above, is only half the size the equipment was designed for, and surrounded by large boulders.

Corroding glacier in crater rim gully?

Gully in crater rim
Click for full image.

Today’s cool image to the right, rotated and cropped to post here, shows a gully flowing down the north facing rim of a 30-mile-wide crater in the southern cratered highlands. It was taken on June 30, 2020 by the high resolution camera on Mars Reconnaissance Orbiter (MRO).

To my eye the corroded ridges and pits running down the western side of this gully look like a corroded ice, as if we are looking at a glacier that the light of the Sun, which in the southern hemisphere hits this north-facing slope more directly and for longer periods of time, is causing it to sublimate away with time.

The wider shot below shows the entire rim, flowing downhill from the south to the north.
» Read more

A patch of chaos in the Martian cratered southern highlands

A patch of chaos in the southern cratered highlands of Mars
Click for full image.

Today’s cool image, rotated, cropped, and reduced to post here, takes us to the cratered southern highlands of Mars. Taken by the context wide angle camera on Mars Reconnaissance Orbiter, this image shows us a strange isolated patch of what appears to be chaos terrain, which on Mars generally means an area of random knobs and mesas cut by canyons and channels.

The large bulk of chaos terrain on Mars is found near or in the transition zone between the lowland northern plains and the southern cratered highlands, and is thought to have been created by slow erosion, possibly by glaciers. This erosion process is aided by the gradient downhill from those highlands to the lowlands.

This location however is in the middle of the cratered highlands, and shows no obvious slope in any direction. And though the location is in the mid-southern latitudes, there is no obvious evidence of glaciers among these knobs and mesas. Furthermore, the mesas are not all the same height. Instead, a large portion appear to have been shaved off, as if some giant came in with a putty knife and scrapped away at them.

This can be clearly seen by the close-up below, taken by MRO’s high resolution camera on July 16, 2002 of the area indicated by the white box, which for scale is about 2 1/4 miles square.
» Read more

Ryugu, like Bennu, appears to have rocks from other asteroids

Japanese scientists today announced that 21 rocks identified by Hayabusa-2 on the asteroid Ryugu have a composition that suggests they were formed on another asteroid.

Although Ryugu’s surface is uniformly dark [because it is a C-type asteroid], the scientists behind the new research found numerous boulders scattered across the asteroid that were 1.5 or more times brighter than their surroundings — that is, they reflected at least 50% more light than most of the rest of Ryugu. This contrast made the researchers suspect these boulders may have come from outside the asteroid.

By analyzing the spectrum of light reflected off 21 of these boulders, the scientists deduced they were made of minerals known as anhydrous silicates. Prior studies have suggested that such water-poor, silicon-rich rocks make up silicaceous or S-type asteroids, the most common kind of asteroid found in the inner main asteroid belt. The brightness of these boulders also matches the brightness of S-type asteroids.

This result compliments the result yesterday from scientists studying Bennu with OSIRIS-REx, and was in fact released at the same time. Both asteroids apparently contain material from other asteroids, suggesting that asteroids in their initial formation (as rubble piles) are routinely a mixture of material from many asteroids, thrown out during impacts and then recaptured.

Despite fading epidemic governments vow to maintain lockdowns

Graph of U.S. deaths day to day through September 21, 2020

The lockdowns will never end: Despite the continuing and steady decline in COVID-19 deaths and cases, most state governments are vowing to maintain their lockdowns and mask mandates, some forever or until a vaccine is found.

Numerous high-ranking public authorities throughout the United States have pledged to continue enforcing COVID-19 restrictions — including social distancing rules and mask mandates — even as cases of and deaths attributed to the virus continue a steady two-month decline throughout the country.

Those officials have signaled that the restrictions will not be lifted unless and until an effective vaccine is developed, approved, distributed throughout the country and utilized by enough of the population to create functional herd immunity.

The graph to the right, compiled from this source, shows clearly that the epidemic is fading, and even at its peak never came even close to the terrifying predictions, all now proven to be wrong, of a lot of health officials and junk modeling scientists.

In fact, the numbers continue to show that coronavirus is really nothing more than a bad flu. Like the flu, it is relatively harmless to the young and healthy, who either will show no symptoms from it at all, or might get sick for a week or so and then recover completely. And like the flu, it is only really dangerous to the old and sick, who already have serious health problems which make them vulnerable to any new illness.

Note too that the average age at death from COVID-19 is about 78 years old, which is also identical to the average age expectancy of Americans. In other words, the disease did little to change the number of deaths at all. Even if there were excess deaths this year, they were not much more than we’ve had in previous bad flu seasons, and those additional deaths had no effect on the general population.

For such a disease, you do what we have done for centuries, you protect the weak, and let everyone else live their lives normally. We did not do this this time, and are now suffering from it.

Worse, too many people seem unwilling to accept the reality that the epidemic is ending. Instead, they get outraged by anyone who even suggests such a thing. They have fallen in love with their fear, and want to embrace it, forcing masks and restrictions on everyone forever, just so that they have a false sense of safety.

Unfortunately too many of our fascist governors and health bureaucrats have decided to take full advantage of that panicky fear and use it to gain more power over everyone. As it is said, power corrupts, and absolute power corrupts absolutely. For the past six months we have seen a perfect demonstration of this.

Martian channels within Martian channels

Channels within channels on Mars
Click for full image.

Whatever caused the meandering canyons on Mars, whether glaciers or liquid water, it was a process that was long-lived and multi-staged, as indicated by today’s cool image to the right, rotated, cropped, and reduced to post here. This photo, taken on June 28, 2020 by the high resolution camera on Mars Reconnaissance Orbiter (MRO), shows a large canyon cutting downward from a high ridgeline to the north. As that canyon begins to flow out out of the mountains and into the plains to the south, a secondary inner channel appears, meandering down the center of the larger canyon.

This canyon is located at 35 degrees south latitude, in the mid-latitude region where scientists have found evidence of a lot of glaciers. In fact, there are some hints of eroded glacial material in the small channels to the west of this main canyon. Also, there appear to be patches of corroding glacial ice on the south-facing slopes of the east and west hills that define the main channel. In the canyon itself however there appear to be few if any glacial-type features.

The overview map below gives the location context.
» Read more

A UV aurora found on Comet 67P/C-G

Using data from Europe’s now completed Rosetta mission to Comet 67P/C-G, scientists have detected evidence that the comet’s interaction with the Sun’s solar wind creates an aurora above the comet in ultra-violet wavelengths.

The data indicate 67P/C-G’s emissions are actually auroral in nature. Electrons streaming out in the solar wind – the stream of charged particles flowing out from the Sun – interact with the gas in the comet’s coma, breaking apart water and other molecules. The resulting atoms give off a distinctive far-ultraviolet light. Invisible to the naked eye, far-ultraviolet has the shortest wavelengths of radiation in the ultraviolet spectrum.

Labeling this phenomenon as an aurora is a bit of hype, as nothing is visible. However, the discovery does tell scientists how this comet’s coma, produced when the comet heats up in its approach to the Sun, interacts with the solar wind, and this in turn can teach them more about that wind, as well as other comets.

Rocks from Vesta on Bennu?

Scientists reviewing data of Bennu from OSIRIS-REx have found six very bright boulders that have a make-up similar to that found on Vesta, which suggests they initially came from that asteroid.

The unusual boulders on Bennu first caught the team’s eye in images from the OSIRIS-REx Camera Suite. They appeared extremely bright, with some almost ten times brighter than their surroundings. They analyzed the light from the boulders using the OSIRIS-REx Visible and Infrared Spectrometer instrument to get clues to their composition. … The signature from the boulders was characteristic of the mineral pyroxene, similar to what is seen on Vesta and the vestoids, smaller asteroids that are fragments blasted from Vesta when it sustained significant asteroid impacts.

Of course it’s possible that the boulders actually formed on Bennu’s parent asteroid, but the team thinks this is unlikely based on how pyroxene typically forms. The mineral typically forms when rocky material melts at high-temperature. However, most of Bennu is composed of rocks containing water-bearing minerals, so it (and its parent) couldn’t have experienced very high temperatures. Next, the team considered localized heating, perhaps from an impact. An impact needed to melt enough material to create large pyroxene boulders would be so significant that it would have destroyed Bennu’s parent-body. So, the team ruled out these scenarios, and instead considered other pyroxene-rich asteroids that might have implanted this material to Bennu or its parent.

The make-up of Vesta matches. While these rocks might have been flung from Vesta during an impact there, eventually to settle on the surface of Bennu, Vesta is not the only possibility. We do not have a good census of the asteroids in the solar system. Others whose make-up is not yet determined could be a source, as well as an asteroid that no longer exists, destroyed by a collision long ago.

Regardless, these rocks confirm that in the process of formation in the early days of the solar system, asteroids of all types exchanged material.

A hint of unexpected fresh ice on Enceladus

Two views of Enceladus
Click for full image.

Using data collected by Cassini while it orbited Saturn for thirteen years, scientists have found that there might be more relatively fresh ice on the surface of the moon Enceladus than previously believed.

Cassini scientists discovered in 2005 that Enceladus – which looks like a highly reflective, bright white snowball to the naked eye – shoots out enormous plumes of ice grains and vapor from an ocean that lies under the icy crust. The new spectral map shows that infrared signals clearly correlate with that geologic activity, which is easily seen at the south pole. That’s where the so-called “tiger stripe” gashes blast ice and vapor from the interior ocean.

But some of the same infrared features also appear in the northern hemisphere. That tells scientists not only that the northern area is covered with fresh ice but that the same kind of geologic activity – a resurfacing of the landscape – has occurred in both hemispheres. The resurfacing in the north may be due either to icy jets or to a more gradual movement of ice through fractures in the crust, from the subsurface ocean to the surface.

The image above, cropped, reduced, and rearranged to post here, shows two views of Enceladus. On the left we are looking at one hemisphere, with the south pole at the bottom. On the right we are looking straight down at the south pole. The red areas are where scientists think there is relatively fresh ice. While the new ice is very pronounced at the south pole, where the tiger-striped vents have been found, the northern ice is much less evident, though clearly there.

That northern fresh ice however might not come from the planet’s interior, as suggested by the press release. It might also be new ice deposited from space that came from those very active tiger stripes. At the present time the data doesn’t allow for any solid conclusions.

1 90 91 92 93 94 279