For the fifth month in a row the Sun has produced practically no sunspots, possibly the longest such stretch since astronomers began recording the sunspot cycle in the 1700s.
This flatlining is very obvious in NOAA’s October update of its graph showing the long term sunspot activity of the Sun, released yesterday, and posted below, with annotations:

The graph above has been modified to show the predictions of the solar science community for the previous solar maximum. The green curves show the community’s two original predictions from April 2007, with half the scientists predicting a very strong maximum and half predicting a weak one. The red curve is their revised May 2009 prediction, extended in November 2018 four years into the future.
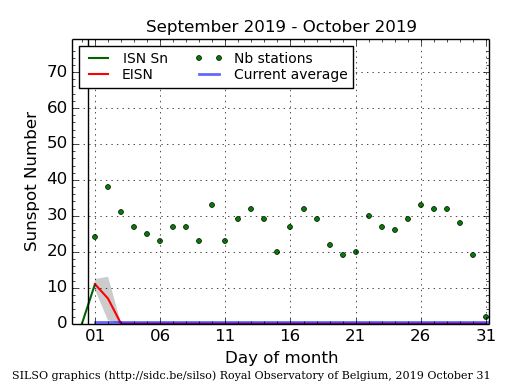
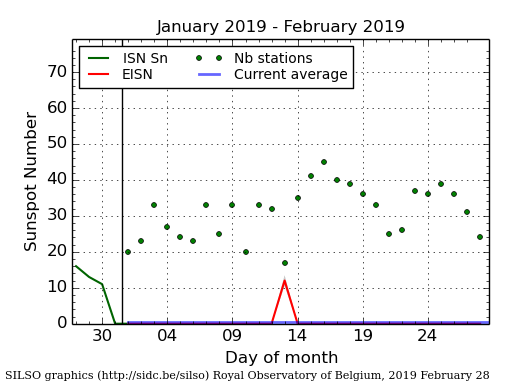
As it has done in previous four months, in October the Sun produced practically no sunspots. The graph on the right, produced by Sunspot Index and Long-term Solar Observations (SILSO), shows only one weak sunspot at the beginning of October.
Even though the previous 2008-2009 solar minimum was one of the deepest and longest ever recorded, the lack of sunspots in the past five months has significantly beaten it for inactivity, as shown on the first graph above. That previous minimum never had a period of even two months with so few sunspots. Furthermore, the Sun has now been blank 74% of the time in 2019, a record of blankness that beats the yearly record of either 2008 or 2009. If the Sun continues to be as blank as it has been for the next two months, 2019 will easily set the record for the year with the fewest sunspots ever recorded.
The big question remains: Are we heading for a grand minimum with no sunspots for decades? We still do not know. Even these unprecedented trends prove nothing, as we really do not yet have a clear understanding of why the Sun undergoes these various cycles of sunspot activity/inactivity. The Sun could still come back to life in the coming years. We can only wait and see. As I noted however in last month’s sunspot update, the arrival of a new grand minumum, the first since the 1600s, could have important consequences:
During past grand minimums there is evidence that the Earth also cooled, though the link between the two phenomenon remains circumstantial and unproven. If we see another grand minimum, and the Earth once again cools, then we might be able to finally tie these two phenomenon together.
It is essential that climate scientists pursue this question. Answering it might very well defuse the fears presently expressed by leftist politicians and the leftist press of an oncoming period of global warming.
At the same time, it might also present us with the possibility of an oncoming period of significant global cooling, during which it will be so cold that we might face crop failures (as happened in the previous grand minimum in the 1600s).
We need to know what is going on with the Sun, and its consequences for Earth, as soon as possible. Whether we can find out this solar cycle is unlikely, but a cold hard look at the data would do much to answer the question.
I wonder however if there any climate scientists around willing to do so. Questioning human-caused global warming carries great career risks. In fact, taking any position counter to the prevailing wisdom on any scientific issue appears to carry risks, as demonstrated by the experience recently when a journal decided to publish a paper that questioned modern gender politics:
» Read more