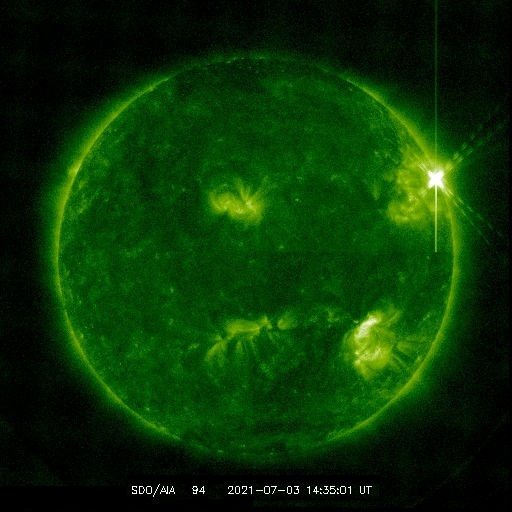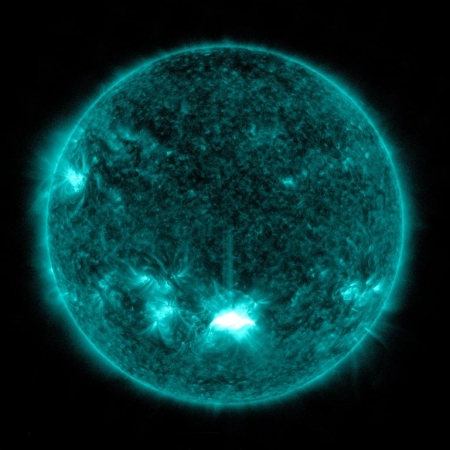
The flare is the bright spot, center bottom. Click for original image.
The Sun today unleashed an X1-class solar flare, one of the more powerful seen since the ramp up to solar maximum began at the start of 2020.
More information here, with this quote:
The blast also hurled a CME [coronal mass ejection] into space. Coronagraph images are not yet available, but evidence for a CME is already pursuasive [sic]. The USAF reports strong Type II and Type IV radio emissions generated by a CME plowing through the sun’s atmosphere. In addition, energetic particles accelerated at the leading edge of a CME have already reached Earth.
When will the CME itself arrive? Assuming that it is Earth directed, probably on Oct. 30th or 31st. Fresh data from SOHO coronagraphs will allow a more precise forecast, so stay tuned.
During the flare, a pulse of X-rays and extreme UV radiation ionized the top of Earth’s atmosphere, causing a strong shortwave radio blackout centered on South America:
Aviators, mariners, and ham radio operators on the daylit side of Earth may have noticed strange propagation effects at frequencies below 30 MHz.
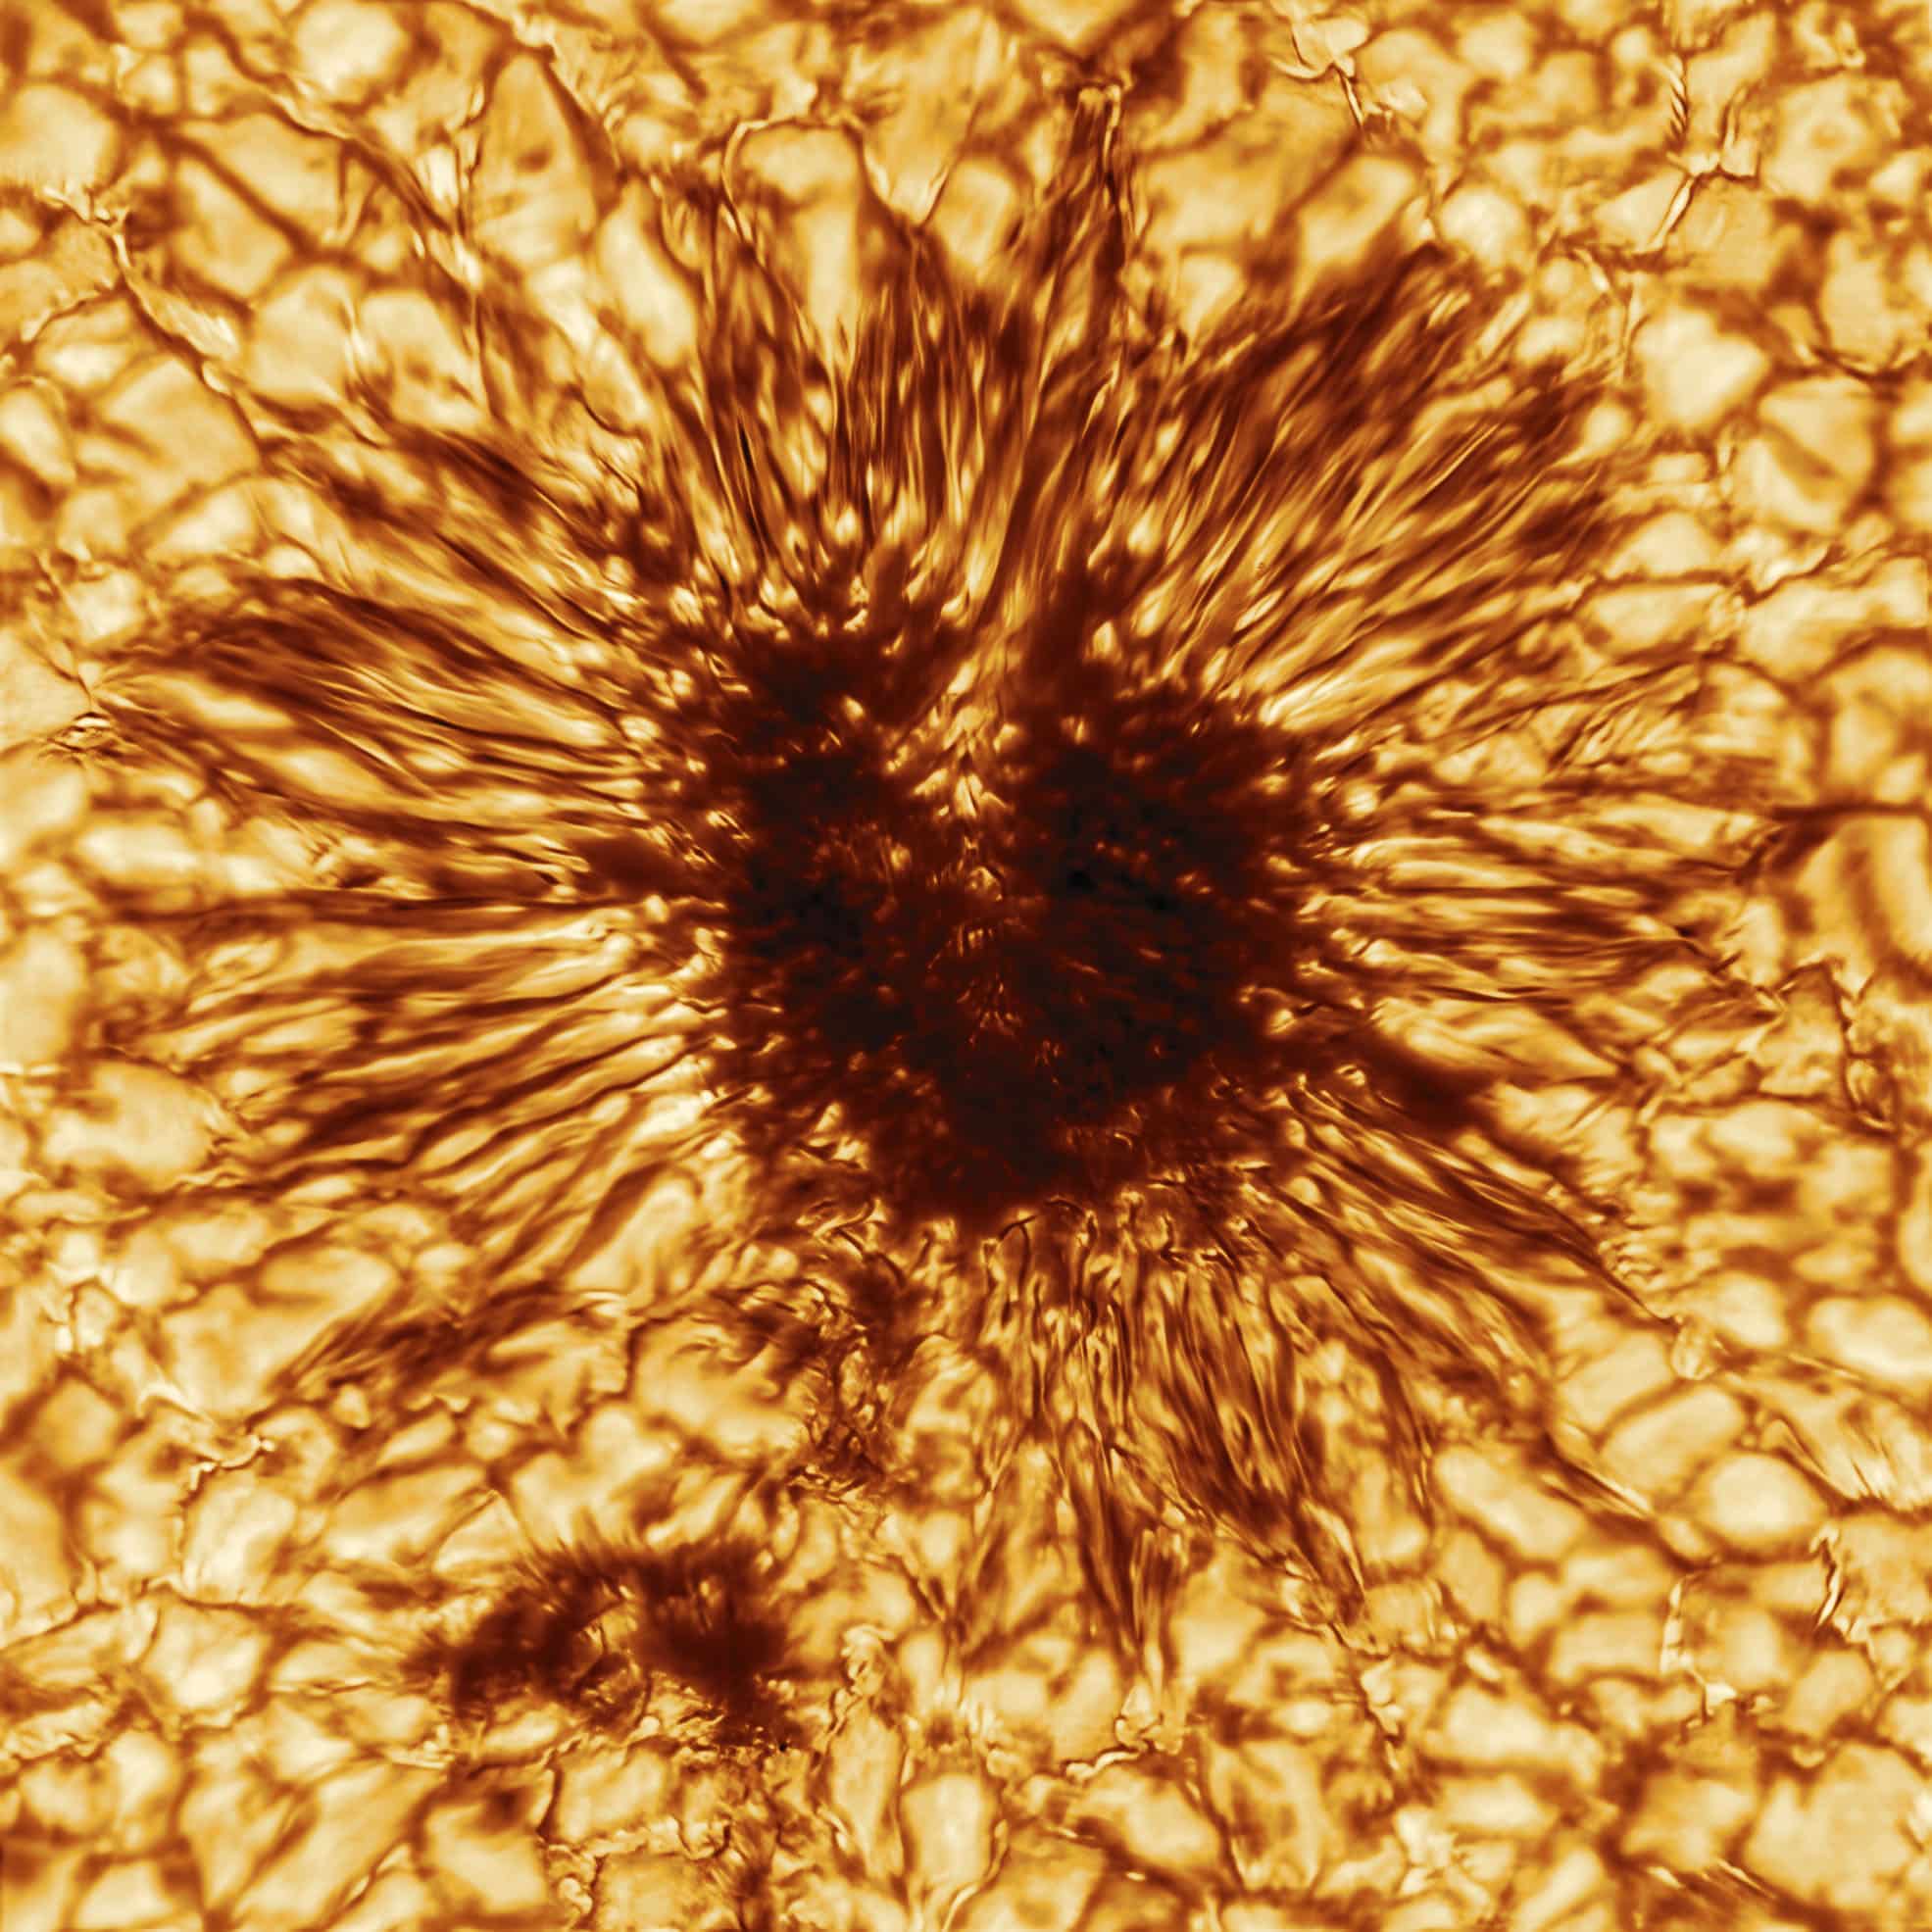
While this flare is unlikely to cause any significant disturbances to orbiting or Earth-based technology, the flare was emitted by a large sunspot that is still active, can still flare again, and is well positioned on the Sun to send more material and radiation Earthward.