It is time to devalue the software research of climate models

When the table of contents of the most recent issue of the American Geophysical Union’s (AGU) Geophysical Research Letters was released on August 16, 2023, I could not help noticing it contained a string of papers repeatedly showing that the models used to prove the coming fire of global warming continue to remain untrustworthy and unreliable. All of the following papers indicated biases and uncertainties of both climate models as well as the data they used, and each did so in their titles:

All of these papers considered the models valid for future research, and were instead focused on refining and increasing the accuracy of the models. All however showed once again how little we should trust these models.

What makes the publication of these papers significant is that it was the AGU that published them, even though the AGU has a decidedly biased editorial policy in favor of global warming. Despite the AGU’s insistence that “realistic and continually improving computer simulations of the global climate predict that global temperatures will continue to rise as a result of past and future greenhouse gas emissions,” it still cannot avoid publishing papers that repeatedly disprove that conclusion.
» Read more

Scientists: Neptune’s clouds appear to ebb and grow in conjunction with sunspot cycle

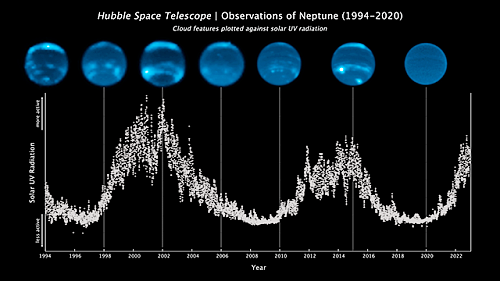
Graph showing correlation between Neptune's clouds and the sunspot cycle

Scientists have now discovered what appears to be a link between the coming and going of clouds on Neptune to the Sun’s 11-year-long sunspot cycle, despite Neptune receiving only 1/900th the sunlight of the Earth.

To monitor the evolution of Neptune’s appearance, Chavez and her team analyzed images taken from 1994 to 2022 using Keck Observatory’s second generation Near-Infrared Camera (NIRC2) paired with its adaptive optics system (since 2002), as well as observations from Lick Observatory (2018-2019) and the Hubble Space Telescope (since 1994). In recent years the Keck Observatory observations have been complemented by images taken as part of Keck Observatory’s Twilight Observing Program and by Hubble Space Telescope images taken as part of the Outer Planet Atmospheres Legacy (OPAL) program.

The data revealed an intriguing pattern between changes in Neptune’s cloud cover and the solar cycle – the period when the Sun’s magnetic field flips every 11 years, causing levels of solar radiation to fluctuate. When the Sun emits more intense ultraviolet (UV) light, specifically the strong hydrogen Lyman-alpha emission, more clouds appear on Neptune about two years later. The team further found a positive correlation between the number of clouds and the ice giant’s brightness from the sunlight reflecting off it.

“These remarkable data give us the strongest evidence yet that Neptune’s cloud cover correlates with the Sun’s cycle,” said de Pater. “Our findings support the theory that the Sun’s UV rays, when strong enough, may be triggering a photochemical reaction that produces Neptune’s clouds.”

The graph to the right shows the correlation between the clouds and the sunspot cycle. The paper is available here.

This conclusion remains uncertain because of the overall sparseness of the data. Yet, it is intriguing, and also underlines the importance of the Sun on the Earth’s climate. If the solar cycle can impact Neptune’s climate so significantly from 2.8 billion miles away, it certainly must have a major impact on the Earth’s climate at only 100 million miles distance.

Sunspot update: In July the Sun continued its high sunspot activity

Today NOAA released its monthly update of its graph that tracks the number of sunspots on the Sun’s Earth-facing hemisphere. As I have done every month for the entire thirteen years I have been doing this website, I have posted that updated graph below, adding to it some extra details to provide some context.

Though the sunspot count in July was slightly less than the very high numbers in June (the highest seen in more than two decades), the decline was almost inconsequential. Except for June’s activity, the activity in July was still the highest sunspot count in a month since September 2002, when the Sun was just beginning its ramp down after its solar maximum that reached its peak in late 2001. From that time until the last two months, the Sun had been in a very prolonged quiet period, with two solar minimums that were overly long and a single solar maximum that was very weak with a extended double peak lasting almost four years.
» Read more

Scientists increasingly put politics over uncertainty in their research papers

The modern scientific method

The death of uncertainty in science: According to a paper published this week in the peer-review journal Science, scientists in recent years are increasingly abandoning uncertainty in their research papers and are instead more willing to make claims of absolute certainty without hesitation or even proof.

If this trend holds across the scientific literature, it suggests a worrisome rise of unreliable, exaggerated claims, some observers say. Hedging and avoiding overconfidence “are vital to communicating what one’s data can actually say and what it merely implies,” says Melissa Wheeler, a social psychologist at the Swinburne University of Technology who was not involved in the study. “If academic writing becomes more about the rhetoric … it will become more difficult for readers to decipher what is groundbreaking and truly novel.”

The new analysis, one of the largest of its kind, examined more than 2600 research articles published from 1997 to 2021 in Science, which the team chose because it publishes articles from multiple disciplines. (Science’s news team is independent from the editorial side.) The team searched the papers for about 50 terms such as “could,” “appear to,” “approximately,” and “seem.” The frequency of these hedging words dropped from 115.8 instances per 10,000 words in 1997 to 67.42 per 10,000 words in 2021.

Those numbers represent a 40% decline, a trend that has been clear for decades, first becoming obvious in the climate field. » Read more

All UN climate models vastly over-estimate warming in the U.S.

climate models vs observations

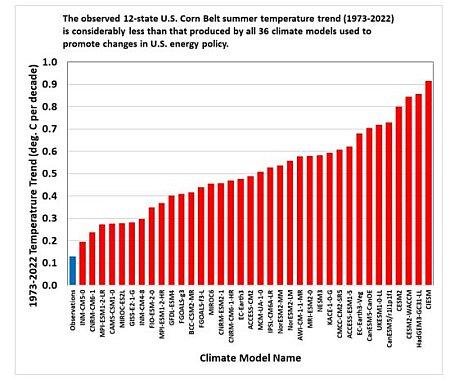
According to a direct comparison between actual data and the three-dozen climate models used by the UN’s Intergovernmental Panel on Climate Change, the models all overestimate the warming that has happened, sometimes by ridiculous amounts.

The graph to the right shows “the 50-year area-averaged temperature trend during 1973-2022 for the 12-state corn belt as observed with the official NOAA homogenized surface temperature product (blue bar) versus the same metric from 36 CMIP6 climate models [red bars].”

This story isn’t new, and in fact to me has become somewhat boring because the results are always the same. The computer models that global warming climate scientists have pushed at us for decades have been consistently wrong. They routinely have over-predicted the amount of warming. Since such models are expressly designed to provide us reliable predictions, and these models are not reliable or correct, I find it absurd to pay any attention to them.

At the same time, this repeated and continuing failure needs to be mentioned periodically, because politicians and climate warming activists (I repeat myself) continue to ignore this failure as they wave these models around like red flags that must to be obeyed. Not only should these models be ignored, our governments and science community should stop funding these people. Their work is a failure. They don’t deserve further grants.

Let me add one more important note: The observations show an increase of about 0.2 degrees Fahrenheit per decade. This increase is almost a rounding number, considering the amount of random fluctuations that is routinely seen in the global climate temperature. Even if the trend was extended for a century (something that is not guaranteed at all), the increase would still be only two degrees, hardly a worry.

Sunspot update: June saw the most sunspots in more than two decades

Time for our monthly sunspot update, based on NOAA’s monthly graph that tracks the number of sunspots on the Sun’s Earth-facing hemisphere. I have posted that graph below, but have added some extra details to provide some context.

June saw the highest sunspot count in a month since September 2002, when the Sun was just beginning its ramp down after its solar maximum that reached its peak in late 2001. From that time until now, the Sun has been in a very prolonged quiet period, with two solar minimums that were overly long and a single solar maximum that was very weak with a extended double peak lasting almost four years.
» Read more

Greta Thunberg: All humanity is now extinct on Earth, because we didn’t do anything about global warming

Greta Thunberg speaks!

How dare you! On June 21, 2018, Greta Thunberg informed us — as shown in her tweet to the right — that we only had five years left to stop using fossil fuels, and if we didn’t “climate change will wipe out all of humanity.”

I am hardly the only person to note this example of global warming fraudulence. Numerous reporters have also gleefully noted it, with this essay today at American Thinker by Andrea Widburg probably the most damning, not so much for noting the ignorant rantings of this uneducated high school drop-out whom the left made their icon of knowledge and top global warming expert, but for the list she provides of the endless number of other failed doomsday predictions by global warming activists and politicians.

That list was compiled in 2019, and thus it did not yet include Thunberg’s absurd prediction. Nor did it include the endless string of additional false doomsday predictions that this crowd has continued to issue in the years since, all of which I guarantee without any uncertainty will all fail, just as their hundreds of past doomsday predictions have failed.

You see, the point of those predictions was not to educate, but to instill fear, so as to then justify a power grab by the government. As Widburg concludes:
» Read more

Sunspot update: May activity once again far above prediction

With the start of the month it is time once again for our monthly sunspot update, based on the new data that NOAA today added to its own monthly graph that tracks the number of sunspots on the Sun’s Earth-facing hemisphere. I have posted that graph below, but have added some extra details to provide some context.

In May the number of sunspots zipped upward again, ending up at the second highest monthly count during this ramp up to solar maximum, and the second highest count since the last solar maximum in 2014.
» Read more

Sunspot update: April activity drops steeply

NOAA this week once again published an update of its monthly graph that tracks the number of sunspots on the Sun’s Earth-facing hemisphere. As I do every month, I have posted this graph below, with some additional details included to provide some context.

In April the number of sunspots dropped again, for the second time in the past three months. The high activity previously had suggested that the solar maximum was going to be much higher than predicted, or possibly would come sooner than expected. The drop however now suggests that the fast rise in sunspot activity that we have seen since the beginning of the ramp up to solar maximum in 2020 might finally be abating.
» Read more

If global warming doesn’t kill us the fog will!

Shipping routes
Illustration showing the distance and time saved by going north
through the Arctic Ocean

A new report published by the American Geophysical Union, and touted by it though a press release today, says that while the melting Arctic Ocean icecap — caused by human-caused global warming — will make shipping more convenient, that shipping will be hindered by increased fog — caused by human-caused warming.

Arctic sea ice has been shrinking for decades. That loss has opened shipping channels in the Northwest Passage and the Northern Sea Route, allowing even non-icebreaker vessels to skip the time-consuming Panama and Suez Canals farther south. But as the ice recedes, cold air is exposed to more warm water, and warm vapor condenses into fog in those new passages. Hidden chunks of ice already pose risks to vessels making their way through foggy, low-visibility routes.
» Read more

Scientists predict solar maximum to arrive one year early

The scientists whose prediction of a more active upcoming solar maximum that has so far turned out more accurate than the consensus prediction have now updated their prediction, lowering it somewhat but also predicting the maximum will occur one year early, in 2024 instead of 2025.

The team’s finalized forecast for the current cycle expects it to peak in late 2024, one year earlier than NASA and NOAA had predicted. The cycle, the team thinks, will reach about 185 monthly sunspots during its maximum and thus be somewhat milder than what the team originally forecasted. This peak intensity will place this cycle at about the average compared to the historical record.

In other words, now that we are about halfway to maximum, they have concluded that while NOAA’s prediction was too low, their prediction was too high. They have now adjusted their expectations to be closer to what they now think will happen.

A short solar cycle however has historically corresponded to much higher sunspot activity. If this new prediction is correct (a short cycle with a mild maximum), it will mean that the Sun is still behaving in ways that the solar science community does not understand, or can predict.

Sunspot update: Activity remained high in March

It is time for my monthly sunspot update. NOAA this week updated its graph that tracks the number of sunspots on the Sun’s Earth-facing hemisphere. This graph is posted below, with some additional details included to provide some context.

Last month the number of sunspots dipped slightly after a gigantic leap of activity in January. This month showed a small rise in activity, but not enough to bring levels back to the January’s levels. Nonetheless, activity remains the highest seen since 2014. when the last solar maximum was approaching its end, and continues to exceed significantly the 2020 prediction by NOAA’s panel of solar scientists.
» Read more

AGs from 22 states blast Biden’s attempt to illegally insert racial quotas and climate change into federal contracting law

Alexandria Ocasio-Cortez
Joe Biden imposes Alexandria Ocasio-Cortez’s
Green New Deal on all federal contractors

In May 2021 President Biden signed an executive order [pdf] requiring federal agencies to make climate change and helping “disadvantaged communities and communities of color” a major priority in all their work.

That executive order, which in many ways was simply a rewording of Alexandria Ocasio-Cortez’s communist and bigoted Green New Deal, required agencies to do things like reconsider where their pension funds were invested and to change those investments — not to get the best return on the dollar as required by law — but to protect them from “the threats of climate-related financial risk.”

The executive order also demanded that the Federal Acquisition Regulatory Council (FARC) require federal contractors to:

…publicly disclose greenhouse gas emissions and climate-related financial risk and to set science-based reduction targets; and (ii) ensure that major Federal agency procurements minimize the risk of climate change, including requiring the social cost of greenhouse gas emissions to be considered in procurement decisions and, where appropriate and feasible, give preference to bids and proposals from suppliers with a lower social cost of greenhouse gas emissions. [emphasis mine]

» Read more

Sunspot update: After going through the roof last month, sunspots drop into the attic this month

With the start of another month NOAA this week updated its graph that tracks the number of sunspots on the Sun’s Earth-facing hemisphere. As I do every month, I have posted that updated graph below, adding some additional details to provide some context.

Last month the number of sunspots rocketed upward to the highest seen since 2014, and only the second time since November 2002 that the Sun was that active. In February those high numbers dropped, though the sunspot activity during the month remained well above the 2020 prediction by NOAA’s panel of solar scientists.

» Read more

Sunspot update: Sunspots in January went through the roof!

NOAA this week updated its monthly graph that tracks the number of sunspots on the Sun’s Earth-facing hemisphere. Below is that updated graph, with January’s numbers added to the timeline. As I have done monthly for the past dozen years here on Behind the Black, I have added some additional details to that graph to provide context.

Just as in December, the number of sunspots in January 2023 shot up to the highest amount since September 2014, which was during the previous solar maximum. Unlike December, however, January’s numbers came only a hairs-breath from topping that 2014 number. In fact, except for that one 2014 month, January 2023 saw the most sunspots on the Sun since November 2002, twenty years ago. In 2002 the Sun was ramping down from what had been a relatively strong double-peaked solar maximum, and was about to begin an extremely long period of little or no activity, followed by a very weak double-peaked solar maximum in 2013.

That period of little activity also corresponded with a long twenty-year period in which the Earth’s climate appeared to stop warming.
» Read more

Sunspot update: The most sunspots since 2014

Time for my monthly sunspot update, based on NOAA’s monthly graph that tracks the number of sunspots on the Sun’s Earth-facing hemisphere. The newest graph, with December’s numbers added to the timeline, is below. As always, I have added some additional details to provide context.

In December the half-year pause in the ramp up to solar maximum ceased, with the Sun seeing the most sunspots since September 2014. This high activity far exceeded the predicted sunspot count for December 2023, almost doubling it. In fact, December’s sunspot count almost equaled the predicted peak for the upcoming solar maximum, which is not supposed to happen until sometime in 2025.

» Read more

SpaceX launches oceanography satellite

SpaceX early this morning used its Falcon 9 rocket to successfully launch an oceanography satellite, dubbed SWOT, for both NASA and France’s space agency CNES.

The satellite it designed to measure the height of water on 90% of the Earth’s surface.

The first stage was making its sixth flight, and successfully returned to Earth, touching down on its landing pad at Vandenberg Space Force Base.

The leaders in the 2022 launch race:

59 China
57 SpaceX
21 Russia
9 Rocket Lab
8 ULA

The U.S. now leads China 81 to 59 in the national rankings, but trails the entire world combined 91 to 81.

These numbers however should change again later today, as SpaceX has another launch scheduled.

NOAA once again over-predicts the hurricane count

As it has done repeatedly in recent years, NOAA in 2022 once again over-predicted the hurricane count for this past hurricane season, predicting an above-normal season when it actually ended up to be well below-normal.

In late May and again in early August 2022 NOAA predicted that the year 2022 Atlantic Hurricane Season (between June to end November calendar period) would be an “above normal” season with 14-21 named storms, between 6-10 hurricanes including 3-6 major hurricanes (Category 3,4 and 5) as shown in NOAA’s diagram below.

Colorado State University’s Department of Atmospheric Science/Tropical Meteorology Project has compiled the year 2022 tropical storm data, establishing that, compared to its 30 year North Atlantic data records covering the Climatological period 1991-2020, the year 2022 hurricane season was below average in Named Storms, Named Storm Days, Hurricane Days, Major Hurricanes, Major Hurricane Days and Accumulated Cyclone Energy (ACE).

The many graphs at the link also demonstrate that the predictions that there will be an increase in extreme weather events due to increased use of fossil fuels is also proving false.

Sunspot update: The Sun’s unprecedented pause to maximum continues

It is the beginning of the month, and NOAA has once again published its update of its monthly graph that tracks the number of sunspots on the Sun’s Earth-facing hemisphere. Below is the newest graph, adding November’s numbers to the timeline and annotated by me with some additional details added to provide context.

Sunspot activity dropped in November, though still remained significantly higher than the prediction, a sunspot number of 77.6 compared to the predicted number of 57.4. At 77.6, the Sun continues the pause that began in June in the ramp up to solar maximum. For the past half year the Sun’s sunspot output has essentially stalled at approximately the same level.

» Read more

Not one climate model predicts global temperature; all predict too much warming

Climate models versus actual observations for the past 50 years

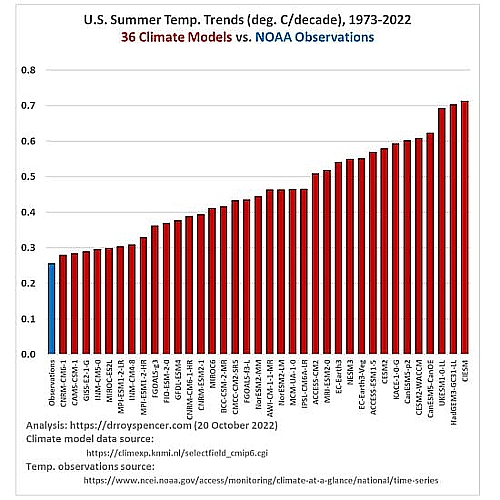
Even as we wait for the final results in numerous elections yesterday, I thought I would throw the chart to the right out for my readers to digest.

The chart was created by climate scientist Roy Spencer of the University of Alabama, who has also been one of the principal investigators for one of NASA climate satellites.

As seen in the accompanying plot, 50-year (1973-2022) summer (June/July/August) temperature trends for the contiguous 48 U.S. states from 36 CMIP-6 climate model experiments average nearly twice the warming rate as observed by the NOAA climate division dataset.

…The official NOAA observations produce a 50-year summer temperature trend of +0.26 C/decade for the U.S., while the model trends range from +0.28 to +0.71 C/decade.

Not one climate model predicted the actual global temperature for the past half century. All predicted too much warming, with about half the models predicting twice as much warming as actually occurred.

In other words, the models continue to express opinion, not science. To rely on any model for establishing climate policy is not only foolish, it is downright irresponsible.

But don’t worry. Joe Biden and the Democrats are on their game, and will shut down all fossil fuel energy sources, because it simply feels right to them.

Meanwhile, on a related side note, the fact that it is no longer possible to finish counting the votes on election day — something that Americans did routinely for more than two centuries long before computers — either is another sign that serious election tampering is going on, or is a clear demonstration that we have entered the new dark age, where it will no longer be possible to accomplish some of the most basic tasks of a true civilization.

In either case, the barbarians rule, and we all suffer because of it.

Sunspot update: The pause in the ramp up to solar maximum continues

NOAA has once again published its monthly update of its monthly graph that tracks the number of sunspots on the Sun’s Earth-facing hemisphere. Below is that November graph, annotated by me with some additional details added to provide context.

Though sunspot number continued to be much higher than the prediction (almost double), October saw almost exactly the same number of sunspots as seen in September, which is why this new graph seems almost identical to last month’s.

In other words, the pause in the ramp up to solar maximum, first noted in August, continues.
» Read more

Deadly climate change on Mars!

Junk science! A new computer simulation by scientists now proposes that there was microscopic life on Mars billions of years ago, but its existence served to destroy the climate and kill all life!

The press appears to be eating this story up, with enthusiasm. From the New Atlas story above:

Humans might not be the first lifeforms in the solar system to face the threat of their own activity changing the climate of their home planet. A new model suggests that ancient Mars was once habitable enough to support methane-producing microbes, and they may have wiped themselves out by causing irreparable damage to the Red Planet’s atmosphere. [emphasis mine]

A Space.com story is written better, but it still jumps on the bandwagon:
» Read more

Sunspot update: Activity again exceeds prediction but ramp up pauses

NOAA this weekend published, as it does at the start of every month, its October update of its monthly graph that tracks the number of sunspots on the Sun’s Earth-facing hemisphere. As I have done since I started this website in 2011, I have published that graph below, with some additional details added to provide context.

An increase in sunspot activity in September wiped out the decline seen in August, so that the sunspot number in September once again matched or exceeded the numbers seen during the middle of the previous solar maximum from 2012 to 2014, a low period of activity between that maximum’s two peaks. Activity also continued to exceed the predictions of the panel of government solar scientists put together by NOAA.

At the same time, since May the ramp up to maximum has stalled, something I noted last month and has now become more evident.
» Read more

Sunspot update: Solar activity continues to exceed sunspot predictions

It is the beginning of September and time to post another update on the Sun’s ongoing solar cycle. Below is NOAA’s monthly graph tracking the number of sunspots on the Sun’s Earth-facing hemisphere, with the activity in August now added. I have also added some additional details to the graph to give the numbers a larger context.

Though sunspot activity dropped in August it remained significantly above the predictions of the panel of government solar scientists put together by NOAA. The predicted sunspot number for August, as indicated by the red curve, was supposed to be about 48. The actual number was 75.

» Read more

Sunspot update: Activity recovers mostly from last month’s decline

It is the start of the month, and thus time to post NOAA’s monthly update of its graph tracking the number of sunspots on the Sun’s Earth-facing hemisphere. That graph is below, with some additional details added by me to provide a larger context.

After the first real decline in sunspot activity in June, the Sun recovered that decline almost completely in July. Though the ramp up to solar maximum has stalled somewhat in the last two months, the trend continues to point to a very active maximum, much higher than predicted as well as much stronger than the last very weak maximum in 2020.

» Read more

Sunspot update: For the first time in 2022, sunspot activity eases

With the year half over, the Sun in June did something it had not done since the start of the year: The number of sunspots seen daily on the Sun’s visible hemisphere actually declined from the month before.

I know this because, as I do every month, I have posted below NOAA’s monthly update of its graph tracking the number of sunspots on the Sun’s Earth-facing hemisphere, with some addition details added to provide a larger context.

» Read more

Scientists claim rocket launches are going to damage ozone layer

Junk science: This week NOAA government scientists published a paper claiming that the upcoming increase in rocket launches worldwide is a threat to the ozone layer and will also — my heart be still — promote climate change!

The study found that a tenfold increase in the amount of soot injected into the stratosphere every year would after 50 years lead to an annual temperature increase in that layer of 1 to 4 degrees Fahrenheit (0.5 to 2 degrees Celsius). The stratosphere is the layer of the atmosphere just above the lowest troposphere. The study found that the projected warming would slow down subtropical jet streams, bands of strong wind circling the planet at the lower edge of the stratosphere that influence the African and Indian summer monsoons.

Warmer temperatures in the stratosphere would also degrade the protective ozone layer, which blocks harmful ultraviolet radiation from the sun from reaching the planet’s surface.

The paper’s abstract also said this:

We show that the rocket black carbon increases stratospheric temperatures and changes the global circulation, both of which cause a reduction in the total ozone column, mainly in the northern high latitudes. Comparing the amplitude of the atmospheric response using different emission rates provides insight into stratospheric adjustment and feedback mechanisms. Our results show that the stratosphere is sensitive to relatively modest black carbon injections.

This is garbage science, and I wouldn’t bother posting a link to it if other news sources weren’t promoting it. These predictions — based on a very simple computer model — are nothing more than guesses, and are apparently designed to both attack the growing space industry as well as garner funding for more such junk science, as illustrated by this quote from the NOAA press release:

“We need to learn more about the potential impact of hydrocarbon-burning engines on the stratosphere and on the climate at the surface of the Earth,” said lead author Christopher Maloney, a CIRES research scientist working in NOAA’s Chemical Sciences Laboratory. “With further research, we should be able to better understand the relative impacts of different rocket types on climate and ozone.”

For almost a half century climate scientists — many working for government agencies like NASA and NOAA — have been publishing junk papers like this, predicting climate doom in only a few decades unless we do as they say, while funneling boatloads of cash into their pockets. Almost none of those predictions have turned out to be correct.

This report is equally suspect, especially because it touts the false statistic that “launch rates have tripled in recent decades.” The number of launches has not tripled from its long-term average since Sputnik. The only way you can get manufacture that fake statistic is if you compare last year’s total (134) with the launch numbers from the early 1960s, before the space race had even begun. And while the launch numbers are likely to rise dramatically in the coming years, the numbers will still be infinitesimal compared to other industries. Going from 50-100 launches to 200-500 launches is hardly the end of the world.

It really is far past time for the press and the general public to stop listening to these fake papers.

The oppressive and ignorant blacklisting culture that now dominates politics

Most of all beware this boy.’
As noted by the Spirit of Christmas Present in Dickens’
The Christmas Carol, ‘This boy is ignorance, this girl is want.
Beware them both, but most of all beware this boy.’

While today’s blacklisting essay is mostly about one specific story, what it really does is illustrate starkly the overall ugliness and ignorance that fuels the blackballing, and how that ugliness and ignorance has seeped into every aspect of our political and cultural lives.

In a story that is hardly unique or surprising, the Los Angeles City Council last week passed a new regulation that bans the use of any gas appliances in new construction, both residential and commercial.

The council’s reasons for imposing this ban — as is usual for such bans — was based not on any actual documented problem that presently exists but on a fear that one might someday occur. From the opening paragraph of the actual motion:

As the gravity and urgency of the climate emergency become more apparent with each passing year of rising temperatures, dangerous wildfires, and more severe droughts—all of which disproportionately impact communities of color and the most vulnerable Angelenos—the City of Los Angeles must do all in its power to reduce its carbon emissions and move toward a sustainable, zero-carbon economy. [emphasis mine]

Note the highlighted words. » Read more

Sunspot update: In May we had sunspots, sunspots, and more sunspots!

It is time for another sunspot update! On June 1 NOAA released its monthly update of its graph tracking the number of sunspots on the Sun’s Earth-facing hemisphere. As I do every month, I have posted it below, having added some addition details to provide a larger context.

In May the sunspot activity on the Sun almost literally exploded, producing some of the strongest solar flares in years as well as the most sunspots since the previous solar maximum in 2014. On several days there were as many as eight sunspot groups on the Sun, with one so large that it was visible to the naked eye on Earth (if viewed properly with a protective filter).
» Read more

1 2 3 4 23