Climate scientists massage data to create illusion of ocean acidification

More climate fraud: NOAA scientists deliberately excluded huge swathes of the ocean acid dataset going back 100 years in order to create the false impression that there has been an increase in ocean acid due to increased CO2. More details here.

How did they do it? They cherry-picked when their dataset would begin, in 1988, rather than using the full dataset beginning in 1920. In addition, they also only used computer models that showed this correlation.

Below the fold I have posted the 2004 graph, produced by these so-called scientists, above a graph using the full dataset of real data. You will see that that the 2004 graph is utter crap.
» Read more

Solar maximum ramp down continues

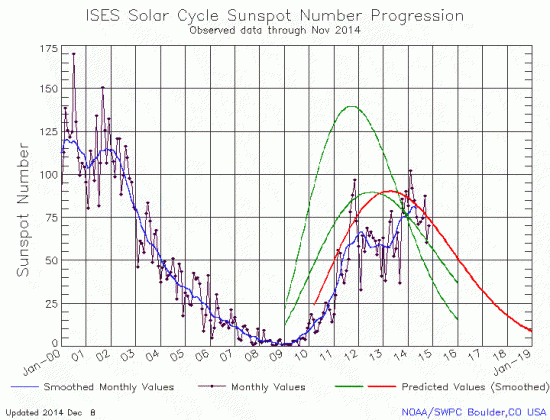
The monthly update by NOAA of the solar cycle, showing the sunspot activity for the Sun in November, was released on December 8, just before NOAA completely revamped its website. As I have been doing every month for the past four years, I am posting it here, with annotations to give it context.

As noted in previous months, the 2009 prediction of the solar scientist community is looking better and better with time. Though there was an increase in sunspot activity in November, the overall trend continues downward very close to that prediction, though at levels that have generally been less than predicted.

November 2014 Solar Cycle graph

The graph above has been modified to show the predictions of the solar science community. The green curves show the community’s two original predictions from April 2007, with half the scientists predicting a very strong maximum and half predicting a weak one. The red curve is their revised May 2009 prediction.

Future updates will depend on whether NOAA continues to track sunspots using these same standards. After much searching I was finally able to locate the graph above at this link, suggesting that at least for now, they are holding to these standards. I note however that the links to the 2007 and the 2009 solar cycle predictions have vanished down the memory hole. Fortunately, I still have this data, and can continue to annotate the graphs to compare prediction with actual data.

That they might have removed these predictions from their webpage however is a shame. I have emailed them to ask them about this and will let you know what I learn.

More evidence of data tampering at NOAA

A close analysis of NOAA climate data from just one randomly picked Texas rural location reveals significant data tampering to make the climate appear to be growing warming.

In other words, the adjustments have added an astonishing 1.35C to the annual temperature for 2013. Note also that I have included the same figures for 1934, which show that the adjustment has reduced temperatures that year by 0.91C. So, the net effect of the adjustments between 1934 and 2013 has been to add 2.26C of warming. ,,,

So what possible justification can USHCN [the climate data center at NOAA] have for making such large adjustments? Their usual answer is TOBS, or Time of Observation Bias, which arises because temperatures are now monitored in the early morning rather than the late afternoon, which tended to be the practice before. But by their own admittance, TOBS adjustments should only account for about 0.2C.

What about station location? Has this changed? Well, not since 1949 according to the official Station Metadata. Luling is a small town of about 5000 people, and the station is situated at the Foundation Farm, 0.7 miles outside town. In other words, a fairly rural site, that should not need adjusting for urban influences.

It is plain that these adjustments made are not justifiable in any way. It is also clear that the number of “Estimated” measurements made are not justified either, as the real data is there, present and correct.

In doing this analysis, the author, Paul Homewood, does something that Steven Goddard of the Real Science website, the man who broke this story, doesn’t do very often: He carefully illustrates the full raw dataset and shows us how he isolates the raw data from the estimated and adjusted numbers. Goddard generally only shows his results, which means we have to trust his analysis. Homewood therefore approaches Goddard’s results skeptically, and thus acts to check his work to see if it is accurate and correct. He finds that it is.

This is science at its best.

I should also note that I found Homewood’s analysis because Steven Goddard posted a link on his own webpage. As a true scientist, Goddard does not fear a close look at his work. He welcomes it.

The scandal of fiddled global warming data.

The mainstream press finally notices: The scandal of fiddled global warming data.

Goddard shows how, in recent years, NOAA’s US Historical Climatology Network (USHCN) has been “adjusting” its record by replacing real temperatures with data “fabricated” by computer models. The effect of this has been to downgrade earlier temperatures and to exaggerate those from recent decades, to give the impression that the Earth has been warming up much more than is justified by the actual data. In several posts headed “Data tampering at USHCN/GISS”, Goddard compares the currently published temperature graphs with those based only on temperatures measured at the time. These show that the US has actually been cooling since the Thirties, the hottest decade on record; whereas the latest graph, nearly half of it based on “fabricated” data, shows it to have been warming at a rate equivalent to more than 3 degrees centigrade per century.

I reported on Steve Goddard’s work back in January. Though these mainstream journalists are very slow in getting the story, it is good that some of them are finally waking up.

NOAA’s official prediction for this winter was worse than monkeys working on typewriters.

The uncertainty of science: NOAA’s official prediction for this winter was as bad as monkeys working on typewriters.

“Not one of our better forecasts,” admits Mike Halpert, the Climate Prediction Center’s acting director. The center grades itself on what it calls the Heidke skill score, which ranges from 100 (perfection) to -50 (monkeys throwing darts would have done better). October’s forecast for the three-month period of November through January came in at -22. Truth be told, the September prediction for October-December was slightly worse, at -23. The main cause in both cases was the same: Underestimating the mammoth December cold wave, which brought snow to Dallas and chilled partiers in Times Square on New Year’s Eve.

But don’t worry. These guys know exactly what’s going to happen to the climate in a hundred years.

NOAA fudges the numbers to turn a January cooling trend since 1930 into a warming trend.

More climate manipulation: NOAA fudges the numbers to turn a January cooling trend since 1930 into a warming trend.

Adjusting the numbers might be justified in certain situations, but NOAA never explains why, and the adjustments they impose always create the illusion of a warming trend, even if the raw numbers say otherwise. If the adjustments were honest, I would expect them to move the numbers up and down much more randomly. That these adjustments only go one way — in favor of global warming — either suggests they are unconsciously allowing their biases to influence their work, or they are intentionally allowing their biases to influence their work.

Either way, their work is meaningless and untrustworthy, and should be ignored as less than worthless.

Multiple U.S. science agencies have been accused of fudging data to fake the existence of global warming.

Someone else has noticed: Multiple U.S. science agencies have been accused of fudging data to fake the existence of global warming.

The “adjustment” schemes in the official U.S. dataset are so drastic, according to Goddard’s analysis, that they managed to “turn a 90 year cooling trend into a warming trend,” he said, suggesting that there may be a “software bug” at work. “Bottom line is that the [NOAA National Climatic Data Center] U.S. temperature record is completely broken, and meaningless,” Goddard concluded. “Adjustments that used to go flat after 1990 now go up exponentially. Adjustments which are documented as positive are implemented as negative.”

Respected climatologist and NASA scientist Dr. Roy Spencer actually showed evidence of what Goddard described as early as April of 2012, saying that “virtually all of the USHCN warming since 1973 appears to be the result of adjustments NOAA has made to the data.” Commenting on the latest findings, Dr. Spencer said that his own examination of the data and corrections to account for urban heat island (UHI) effects “support Steve’s contention that there’s something funny going on in the USHCN data.” He also called the NOAA methodology for adjusting the data “opaque” and said he believes it is prone to serious errors.

This article is essentially covering what I have already noted, that much of the data coming from NASA and NOAA has been seriously compromised, with past temperatures adjusted downward without any clear justification in order to make it appear as if the climate has warmed in recent decades.

I will be talking about this very issue tonight on Coast to Coast.

This year’s hurricane season, predicted to be above average, was the weakest in decades.

The uncertainty of climate science: This year’s hurricane season, predicted to be above average, was the weakest in decades.

This failure also continues a pattern seen in recent years, where the number of actual hurricanes ends up far below their prediction, but the number of named hurricanes still ends up about right (see the charts on the prediction link above). I noted this in 2012, and now it has happened again. As I said then,

I wonder if their naming process was fudged to get them the numbers they wanted. While it might be possible to do that with the naming process of tropical storms, it is far more difficult to fudge the number of actual hurricanes. My skeptical nature and the recent willingness in the climate field to fiddle with data probably makes me more suspicious than I should be.

Thus to me, these seasonal hurricane predictions are becoming increasingly suspect.

Ramping down from solar maximum

Yesterday, despite the government shutdown, NOAA posted its monthly update of the solar cycle, and as I do every month, I am posting it here, below the fold, with annotations.

My interpretation of this data tells me that almost certainly the solar maximum has ended. We might see some later fluctuations whereby the sunspot number jumps, but the Sun is clearly beginning its ramp down to solar minimum.
» Read more

Close-minded politicians everywhere!

Despite the repeated news in recent weeks that the evidence for global warming is slim, or at least confused, today we have two elected officials and one appointed official screaming that the sky will fall if we don’t do something, including spending billions of dollars of other people’s money.

First we have our friend Al Gore, who was in Washington, DC to speak at an environmental event put on by Senator Sheldon Whitehouse (D-Rhode Island). Whitehouse you might remember was the senator who, even before the injured and dead had been counted from the terrible Moore, Oklahoma tornado, started blaming Republicans for the tornado because they weren’t doing more to stop global warming.
» Read more

The Sun crashes

NOAA today released its newest monthly update of the Sun’s sunspot cycle and, as I do every month, I have posted the latest graph, with annotation, below the fold.

The sunspot numbers for December were not only startlingly low, they actually plunged to levels not seen since May 2011, at a time when the Sun is supposed to be approaching sunspot maximum and the number of sunspots is supposed to be increasing.
» Read more

The reason an environmental polar bear scientist has been suspended and under investigation is because while tasked to review and approve research proposals he played favorites, helping to write and revise the government proposal while working against a proposal from private oil companies.

The reason an environmental polar bear scientist has been suspended and is under investigation is because — while tasked to review and approve research proposals — he played favorites, helping to write and revise his preferred proposals while working against proposals from others.

Documents obtained by Nature through the Freedom of Information Act do not reveal the investigators’ conclusions but they suggest a more specific context for Monnett’s troubles: he assisted in the writing of a proposal from the US National Oceanic and Atmospheric Administration (NOAA) that he was also responsible for reviewing for the [US Bureau of Ocean Energy Management (BOEM)]. He also resisted a separate initiative by oil companies.

Over five years, the NOAA study would synthesize knowledge of different elements of the Arctic environment — from marine mammals to fish to zooplankton — and offer conclusions about the overall impact of oil-and-gas exploration there. The NOAA team was awarded the contract last year.

Monnett exchanged e-mails with the NOAA researchers between February and May 2011, made edits to their draft proposal and talked on the phone with them about how to strengthen it. Nature has seen emails from within the BOEM showing that the reason for his suspension in 2011 was management concern about similar assistance being provided to a grant applicant on another contract, which Monnett was also responsible for reviewing.

This is the same scientist whose paper on drowning polar bears has become a favorite with the environmental movement.

The Sun continues to fizzle

Yesterday NOAA posted its monthly update of the ongoing sunspot cycle of the Sun. You can see this latest graph, covering the month of July, below the fold.

As we have seen now for almost four years, the Sun continues to under-perform the predictions of solar scientists when it comes to the number of sunspots it is producing. In fact, that the sunspot number did not rise in July is surprising, as July had appeared to be a very active month for sunspots, with some of the strongest solar flares and coronal mass ejections seen in years. Instead, the number declined ever so slightly.
» Read more

Senate panel proposes major NASA/NOAA budget changes

A Senate panel today proposed shifting the responsibility for building weather satellites from NOAA to NASA.

It is very unclear from this article why the Senate panel proposed this shift. They claim it will save money but I don’t see how.

What I can guess is that there is probably a turf war going on in Congress over this money. For example, shifting these weather satellites to NASA almost certainly means that the Goddard Space Flight Center in Maryland will get more money, which is almost certainly why Senator Barbara Mikulski (D-Maryland) is for it.

One thought however: NASA generally focuses on individual missions, not long term operational stuff like weather. I suspect it probably is not a good idea to give this work to NASA.

The same article above also outlined the panel’s proposals for other areas of NASA’s budget. To me, the key issue is the budget for commercial space. The White House requested $830 million. The Senate panel has instead proposed $525 million.
» Read more

The Sun goes bust

It is that time of the month again. Today NOAA’s Space Weather Prediction Center today released its monthly update of the ongoing solar cycle sunspot activity, covering January 2012. I have posted the graph below the fold.

For the second month in a row the Sun’s sunspot activity plunged. The drop in activity has been so steep that it has cancelled out almost two thirds of the activity rise that occurred during the last half of 2010. In fact, the drop brings the Sun’s sunspot count back to numbers comparable with March of last year, hardly a sign of a fast ramp up to solar maximum, which is what solar scientists have come to expect the Sun to do. Instead, the Sun’s activity during this ramp up has fluctuated wildly, going up strongly for several months and then dropping precipitously for another few months. These wild swings have now repeated themselves four times since the fall of 2010.
» Read more

At House hearing head of NOAA challenged on ignoring Congressional law

At House hearings this week the head of NOAA was attacked for ignoring Congressional law in setting up a National Climate Service.

One big sticking point for legislators is language in this spring’s final 2011 spending bill that averted a government shutdown, which states that “none of the funds made available by this division may be used to implement, establish, or create a NOAA Climate Service.” Representative Dana Rohrabacher (R-CA) said the appointment of Karl and the hiring of six regional directors appear to have ignored those instructions. He quipped that NOAA was “living in climate sin,” a reference to Karl’s statement during an interview in December 2010 with ClimateWire that “we’ve moved in, … we’re waiting for the marriage certificate, but we’re acting like we have a climate service.”

Lubchenco defended her actions, saying that her appointments were “smart” and merely “good planning.” She said their salaries are drawn from “existing funds” and that legislation dating back to the National Climate Program Act of 1978 describes providing climate services as part of NOAA’s mission. She responded to Hall’s concerns that the climate service would take away from NOAA’s other activities by saying, “It’s good government to reorganize periodically.” She also referred to its economic potential, citing the $1 billion industry that has emerged around the National Weather Service.

Speaking with ScienceInsider after the hearing, she made it clear that NOAA intends to push ahead. “This is an idea whose time has come.” [emphasis mine]

In other words, so what the law forbids NOAA from doing this. We know best, Congress can go to hell.

1 2 3 4 5