Jupiter’s endless interweaving storms
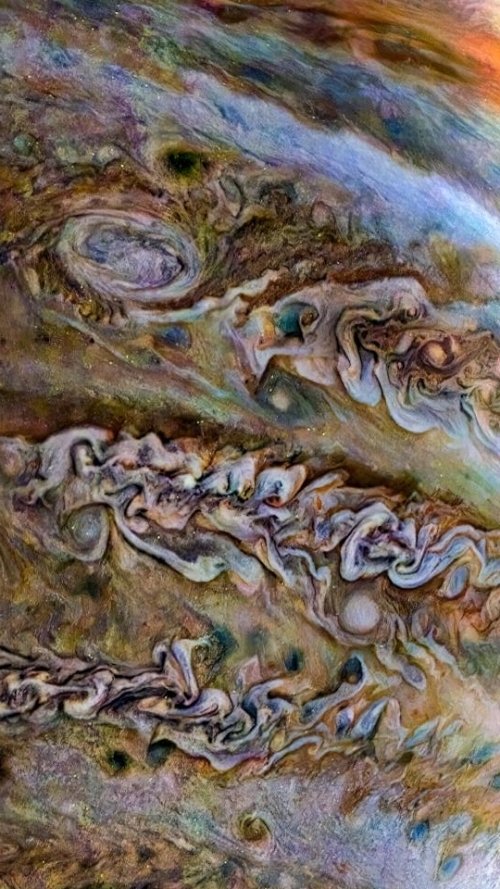
Cool image time! The photo to the right, rotated so that north is up and then reduced slightly to post here, was created by citizen scientist Thomas Thomopoulos from a raw photo taken by Juno during its 44th orbit of Jupiter.
To bring out the details Thomopoulos enhanced the colors, then enlarged the entire photo and cropped the area of interest.
Unfortunately, the Juno team that releases these photos does not provide information for easily establishing scale. In an email to me Thomopoulos noted that the largest circular storm in the northern half of the image is likely a vortex, which on Jupiter tend to range from 600 to 3,500 miles in diameter. He also noted that Juno was a little less than 27,000 miles away from Jupiter when this photo was snapped on August 17, 2022. Thus, I suspect this particular vortex sits on the larger end of that size range, which makes it a little less than half the size of the Earth.
As for the colors, as with many similar Juno images, the white clouds appear to almost always sit at the top of these storms and jets, almost like thunderheads.
Though the largest feature here is that large vortex to the north, most of the gigantic Jupiter storms visible seem instead to form as bands, the storms churning about madly as they are driven along the gas giant’s very fast ten hour rotation period.