Two climate papers of interest

When I appear on radio and am talking about climate change, I often get the same questions over and over.

  • Is the climate warming?
  • If so, is human behavior an important factor for causing that warming?
  • How much does the sun influence climate change?
  • Is the ozone hole linked to climate change?

The truth is that, right now, no one can really answer any of these questions with any certainty. While a large majority of climate scientists might be convinced the Earth is warming and that human activity is causing this warming, the public has great doubts about these claims, partly because of the untrustworthy behavior of many of these climate scientists and partly because the science itself is often confusing.

We simply don’t yet have enough data. Worse, much of the data we do have is tainted, unreliable because of the misconduct and political activism of the very climate scientists who are trying to prove the case for man-made global warming.

Two new papers, published today in Geophysical Research Letters, add some interesting but small data points to this whole subject.
» Read more
1 comment

A fired up Sun

As it does every month, NOAA’s Space Weather Prediction Center today released its monthly update showing the ongoing changes of the Sun’s solar cycle sunspot activity. I have posted the graph below the fold.

For the fourth month in a row the Sun’s sunspot activity has leaped upward. In fact, for the first time since I have been tracking sunspot activity, beginning in 2008, the Sun’s sunspot activity exceeds the predicted activity by a significant amount. Since the end of the previous maximum, the Sun had consistently failed to meet the expectations of solar scientists by producing far fewer sunspots than expected.

In the past few months, however, the Sun has recovered, its activity firing upward, including some of the most active and largest sunspots in years.
» Read more

1 comment

The long minimum continues

Though it has been very clear for the past few months that the sun has finally transitioned from solar minimum and begun its ramp up to solar maximum, that ramp up has also been very slow and wimpy.

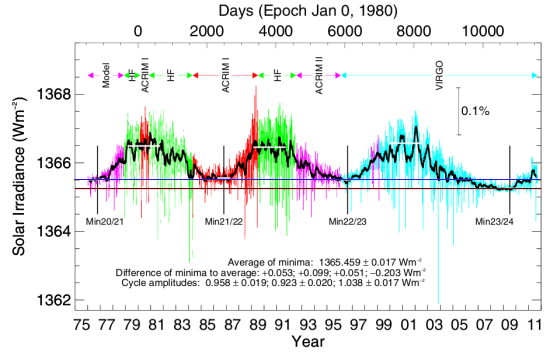
On October 9, 2011 the scientists at Physikalisch- Meteorologisches Observatorium Davos (PMOD) posted an updated summary of the satellite data that has been carefully measuring the variation of the sun’s total solar irradiance since 1978. The graph below, which can be found here [pdf], brings that data up through the present. (I had posted the previous update about a year ago.)

Total solar irradiance

I have added a brown line to illustrate how deep the recently ended solar minimum was, compared to previous minimums. Note also that this most recent minimum would also be far below the minimum prior to 1975. I have also added a blue line to show that the sun has only very recently finally brightened enough to finally exceed the previous minimum. All told, the sun remained dimmer than the previous minimum for over five years!
» Read more

2 comments

The sun’s activity goes boom

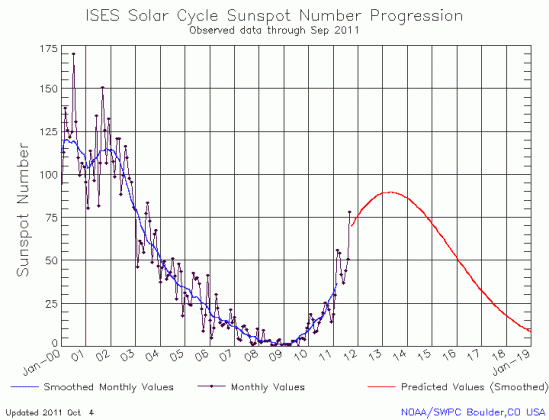
Today NOAA’s Space Weather Prediction Center released its monthly graph of the Sun’s solar cycle sunspot activity. Posted below, it shows the Sun’s activity finally leaping upward in September, after several months of less than expected performance.

It is interesting to see how the sun’s rising sunspot activity for the past year has followed a consistent fluctuating pattern, whereby a sudden monthly jump in sunspots is then followed by several months of decline. If this pattern repeats itself again, we should expect to see the numbers ease off again in October and November.

Regardless, the higher sunspot counts for September are more in line with past predictions. In fact, the solar scientists at the Marshall Space Flight Center have increased their prediction for the time and intensity for the peak of the sun’s maximum. Last month they had called for a peak in May 2013 with a sunspot number of 70. Now, they are predicting the peak will come in April 2013 with a number of 77. They note however that even this higher number will result in the weakest maximum in more than a hundred years.

September sunspot graph

1 comment

The sun’s weak maximum continues

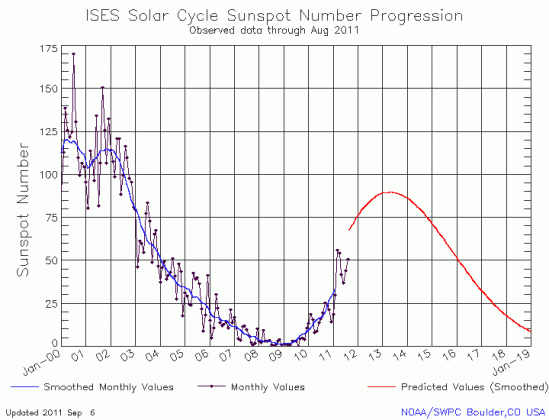
The monthly graph from NOAA’s Space Weather Prediction Center of the Sun’s solar cycle sunspot activity is out and I have posted it below. Though activity increased for the second month in a row, the totals are still below the activity levels of March and April 2011.

I am beginning to think that I sound like a broken record. This monthly graph once again suggests that the next solar maximum will be weak, possibly weaker than the most up-to-date predictions for the next solar maximum. And even if that prediction is correct, the data continues to point towards a quieter Sun, with the likelihood of a long period of no sunspots beginning in the next decade.

Based on past history, the consequences of a long Maunder-type minimum, where there are no sunspots for decades, should be very profound. Every time the Sun has gone this quiet in the past, the Earth’s climate has cooled. Furthermore, new results just released add weight to this conclusion. A less active Sun allows more intergalactic cosmic rays to hit the atmosphere, and the CLOUD experiment at CERN strongly suggests that the higher rate of cosmic rays could in turn increase the atmosphere’s cloudiness, thereby reflecting more light and energy and making the Earth colder.

The sunspot graph for August 2011

0 comments

Kepler team pushes for mission extension

The Kepler team pushes for a mission extension in order to find Earth-sized planets.

The Kepler spacecraft has hit an unexpected obstacle as it patiently watches the heavens for exoplanets: too many rowdy young stars. The orbiting probe detects small dips in the brightness of a star that occur when a planet crosses its face. But an analysis of some 2,500 of the tens of thousands of Sun-like stars detected in Kepler’s field of view has found that the stars themselves flicker more than predicted, with the largest number varying twice as much as the Sun. That makes it harder to detect Earth-sized bodies. As a result, the analysis suggests that Kepler will need more than double its planned mission life of three-and-a-half years to achieve its main goal of determining how common Earth-like planets are in the Milky Way.

While it is important to find those Earth-sized planets, to me the important discovery here is that Kepler is confirming what previous research has suggested: Stars like our Sun are generally far more active and variable than the Sun itself. Which means that either the Sun is unusual, or has been unusually inactive during recorded human history.

0 comments

A blank sun during solar maximum

Though it is not yet official, it appears the sun is blank of sunspots today, for the first time since January 16.

Solar scientists have concluded that the solar minimum of the past four years has ended and that the sun is now moving towards solar maximum. The recent activity in August has seemed to confirm this. However, once the minimum has ended, the sun should not have any further blank days until the maximum is over and the sun is ramping back down to solar minimum. That the sun should appear blank again during its ramp up to solar maximum is quite unusual, probably unprecedented, and is further evidence that the sun is heading towards a period of little or no solar activity.

0 comments

The very slow ramp up to maximum

an active sun

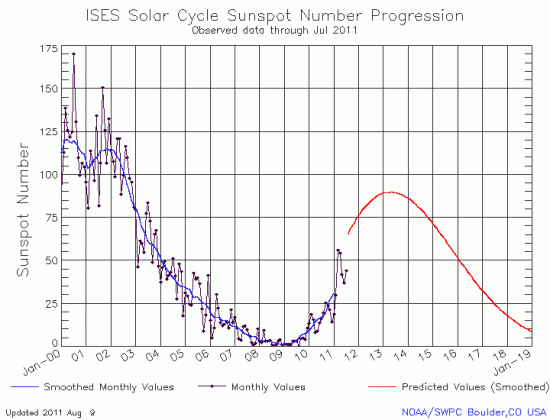
As it does every month, NOAA’s Space Weather Prediction Center released today its monthly updated graph of the Sun’s solar cycle sunspot activity. I have posted the July graph below.

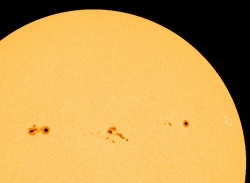
For the first time in four months there was a increase in sunspot activity, albeit small. The sun has been even more active in August, as shown by the flurry of sunspots on its face from August 1 (shown on the left) and the August 8 solar flare, the most powerful produced in four years.

This monthly graph, however, continues to suggest that the next solar maximum will be very very weak, even weaker than the most up-to-date predictions for the next solar maximum.

The sunspot graph for July 2011

0 comments
1 24 25 26 27 28 32