
Decline to solar minimum continues
It’s that time again buckos! On Monday NOAA posted its monthly update of the solar cycle, showing the Sun’s sunspot activity in October. As I have done every month since 2010, I am posting it here, with annotations to give it context.
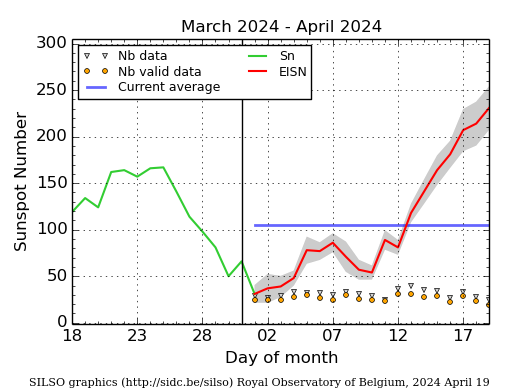
The decline in sunspot continue steadily, matching the red prediction curve except that, as it has for this entire solar maximum, the number of sunspots continues to be less than expected. Not only did the ramp up start later and not quite reach the levels predicted, the ramp down started early. Overall, this now ending solar maximum is the weakest in a century. The big question remains: Is the Sun about to head into its first Grand Minimum since the 1600s, or is this weak maximum a one-time event to be followed by stronger activity in later cycles.
No matter what anyone tells you, no one knows.
The graph above has been modified to show the predictions of the solar science community. The green curves show the community’s two original predictions from April 2007, with half the scientists predicting a very strong maximum and half predicting a weak one. The red curve is their revised May 2009 prediction.
It’s that time again buckos! On Monday NOAA posted its monthly update of the solar cycle, showing the Sun’s sunspot activity in October. As I have done every month since 2010, I am posting it here, with annotations to give it context.
The decline in sunspot continue steadily, matching the red prediction curve except that, as it has for this entire solar maximum, the number of sunspots continues to be less than expected. Not only did the ramp up start later and not quite reach the levels predicted, the ramp down started early. Overall, this now ending solar maximum is the weakest in a century. The big question remains: Is the Sun about to head into its first Grand Minimum since the 1600s, or is this weak maximum a one-time event to be followed by stronger activity in later cycles.
No matter what anyone tells you, no one knows.
The graph above has been modified to show the predictions of the solar science community. The green curves show the community’s two original predictions from April 2007, with half the scientists predicting a very strong maximum and half predicting a weak one. The red curve is their revised May 2009 prediction.


