In the midst of Mars’ volcano country
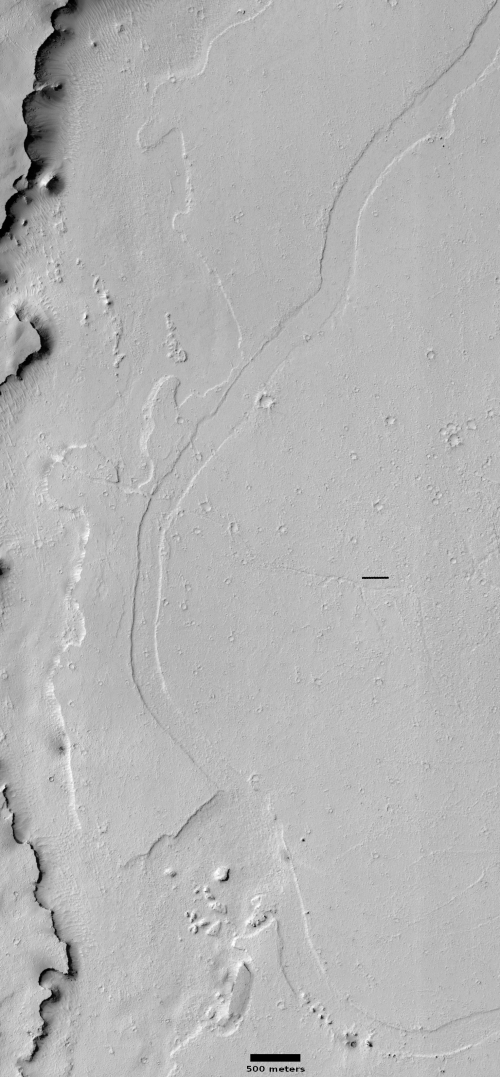
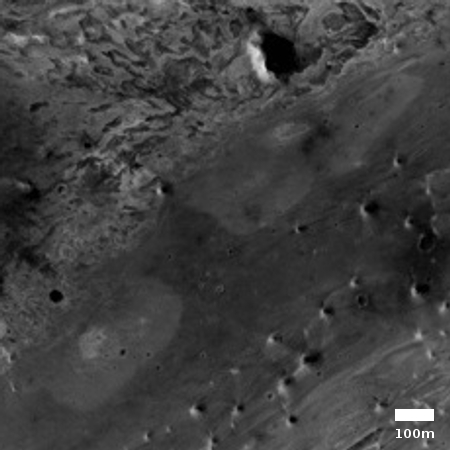
Cool image time! While the rest of the world is entirely focused on panic and disease, I am going to go on with my life. The photo to the right, rotated, cropped, and reduced to post here, was taken by the high resolution camera on Mars Reconnaissance Orbiter (MRO) on December 26, 2019. I suspected this channel was lava, and when I asked Colin Dundas of the U.S. Geological Survey’s Astrogeology Science Center in Arizona, he confirmed my suspicion.
Yes, that surface appears to be lava–it is part of the Elysium plains, which have many geologically-young lava flows. It’s likely that the channel is a lava channel, and the surrounding plains may be from an earlier stage of the same eruption.
The entire surface of the channel and the surrounding plains appear very fresh, mostly because of their smoothness and lack of many craters. You can also see what looks like a recent impact (the small dark splotch near the left edge about two-thirds from the top).
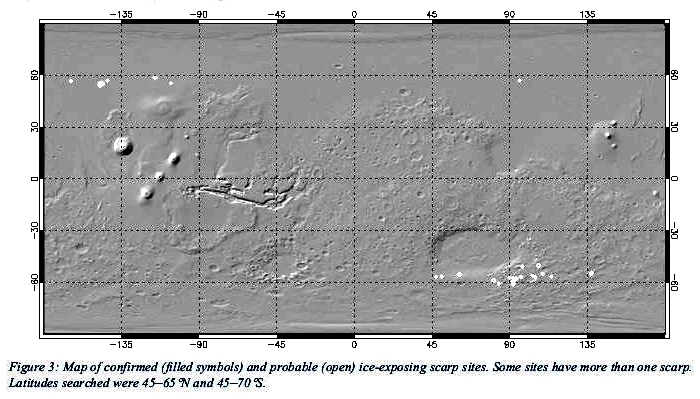
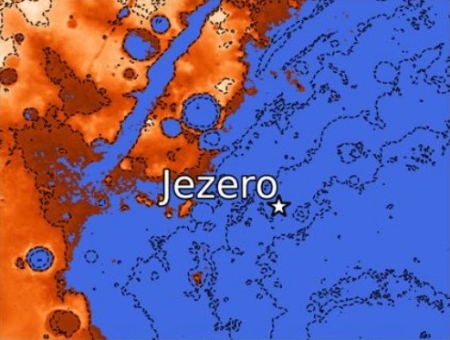
The fresh and smooth look of Elysium Planitia generally has led scientists to conclude that much of this region is formed from lava flows, some relatively recently. Thus, this particular lava channel is smack dab in the middle of Mars’ volcano country, quite vast and extensive. The context map below illustrates this.
» Read more

