A team of solar scientists have proposed a new theory that they think explains the ebb and flow of the Sun’s eleven year solar cycle, and if right can explain the periodic occurrence of grand minimums where there are essentially no sunspots for decades, such as the Maunder Minimum in the 1600s.
The theory proposes that the Sun has two different dynamos that produce different magnetic waves in its interior. Like waves that can either cancel each other out or combine for more power, these two dynamos do the same over time and thus effect the Sun’s sunspot/solar cycle.
“We found magnetic wave components appearing in pairs, originating in two different layers in the Sun’s interior. They both have a frequency of approximately 11 years, although this frequency is slightly different, and they are offset in time. Over the cycle, the waves fluctuate between the northern and southern hemispheres of the Sun. Combining both waves together and comparing to real data for the current solar cycle, we found that our predictions showed an accuracy of 97%,” said Zharkova.
Zharkova and her colleagues derived their model using a technique called ‘principal component analysis’ of the magnetic field observations from the Wilcox Solar Observatory in California. They examined three solar cycles-worth of magnetic field activity, covering the period from 1976-2008. In addition, they compared their predictions to average sunspot numbers, another strong marker of solar activity. All the predictions and observations were closely matched.
Looking ahead to the next solar cycles, the model predicts that the pair of waves become increasingly offset during Cycle 25, which peaks in 2022. During Cycle 26, which covers the decade from 2030-2040, the two waves will become exactly out of synch and this will cause a significant reduction in solar activity.
“In cycle 26, the two waves exactly mirror each other – peaking at the same time but in opposite hemispheres of the Sun. Their interaction will be disruptive, or they will nearly cancel each other. We predict that this will lead to the properties of a ‘Maunder minimum’,” said Zharkova. “Effectively, when the waves are approximately in phase, they can show strong interaction, or resonance, and we have strong solar activity. When they are out of phase, we have solar minimums. When there is full phase separation, we have the conditions last seen during the Maunder minimum, 370 years ago.”
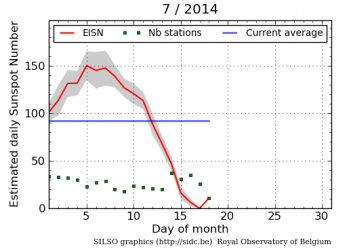
And on this same subject, last week NOAA posted its monthly update of the solar cycle, showing the Sun’s sunspot activity in June. As I have done every month since 2010, I am posting it here, below the fold, with annotations to give it context.
» Read more


