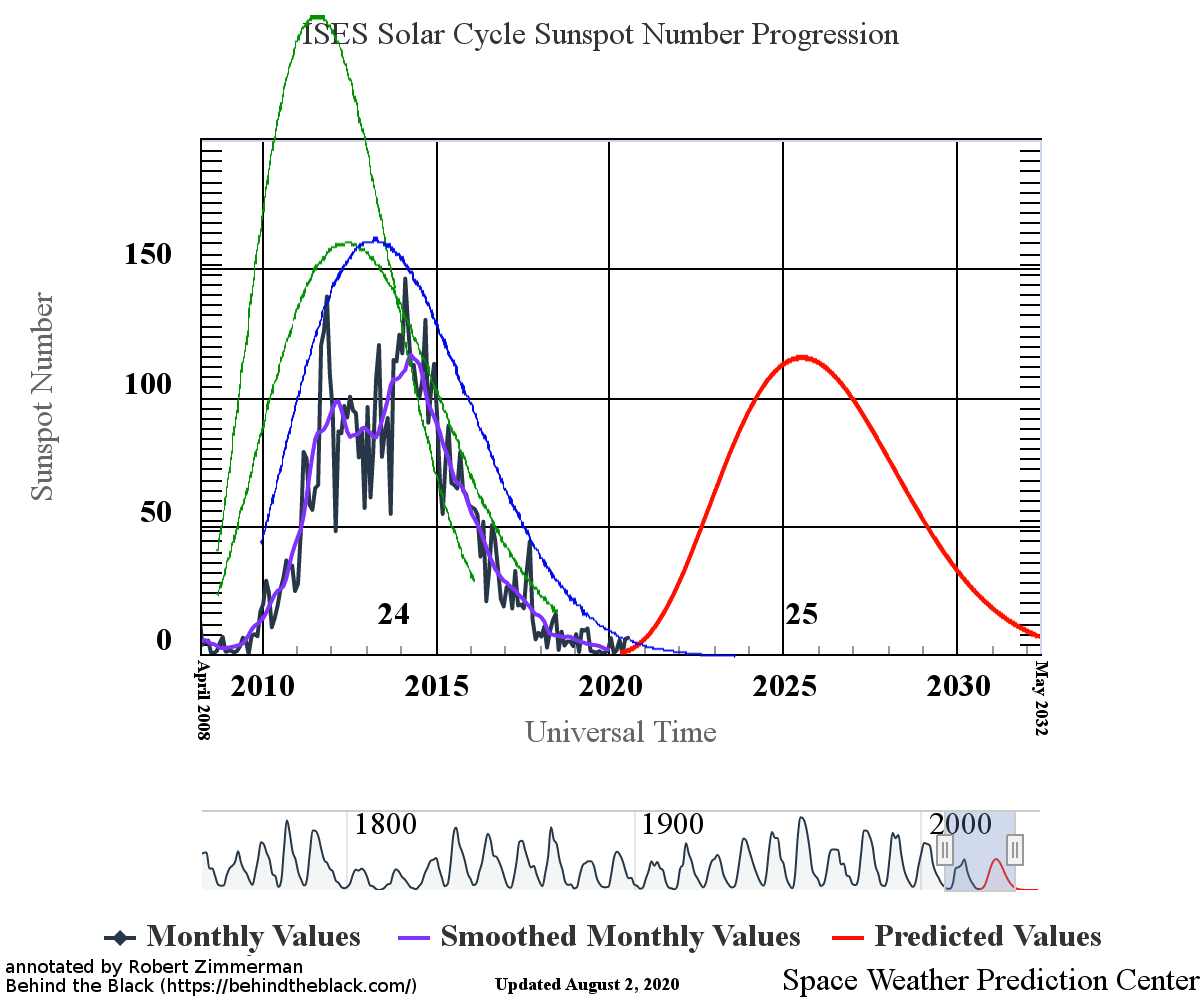
NOAA last week updated its monthly graph for tracking the Sun’s monthly sunspot activity. As I have done now for every month since 2011, I am posting that graph elow with additional annotations by me to show the past and new solar cycle predictions.

The graph above has been modified to show the predictions of the solar science community for the previous solar maximum. The green curves show the community’s two original predictions from April 2007 for the previous maximum, with half the scientists predicting a very strong maximum and half predicting a weak one. The blue curve is their revised May 2009 prediction. The red curve is the new prediction, first posted by NOAA in April 2020.
August continued the trends seen in the past two months whereby sunspot activity actually exceeded the prediction for this particular month.
Does this mean the prediction of a weak maximum in 2025 will be wrong? Hardly. Sunspot activity in any given month can easily be above or below the prediction, as is obvious if you compare the fluctuations of the last maximum with the prediction. We will not really know if these higher numbers the past few months mean anything until a lot more time has passed, with the gathering of a lot more data.
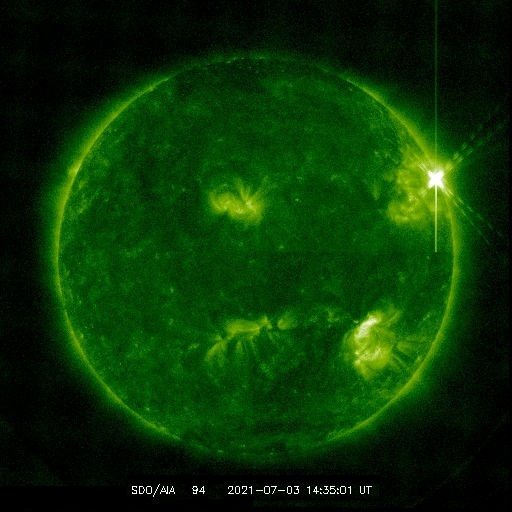
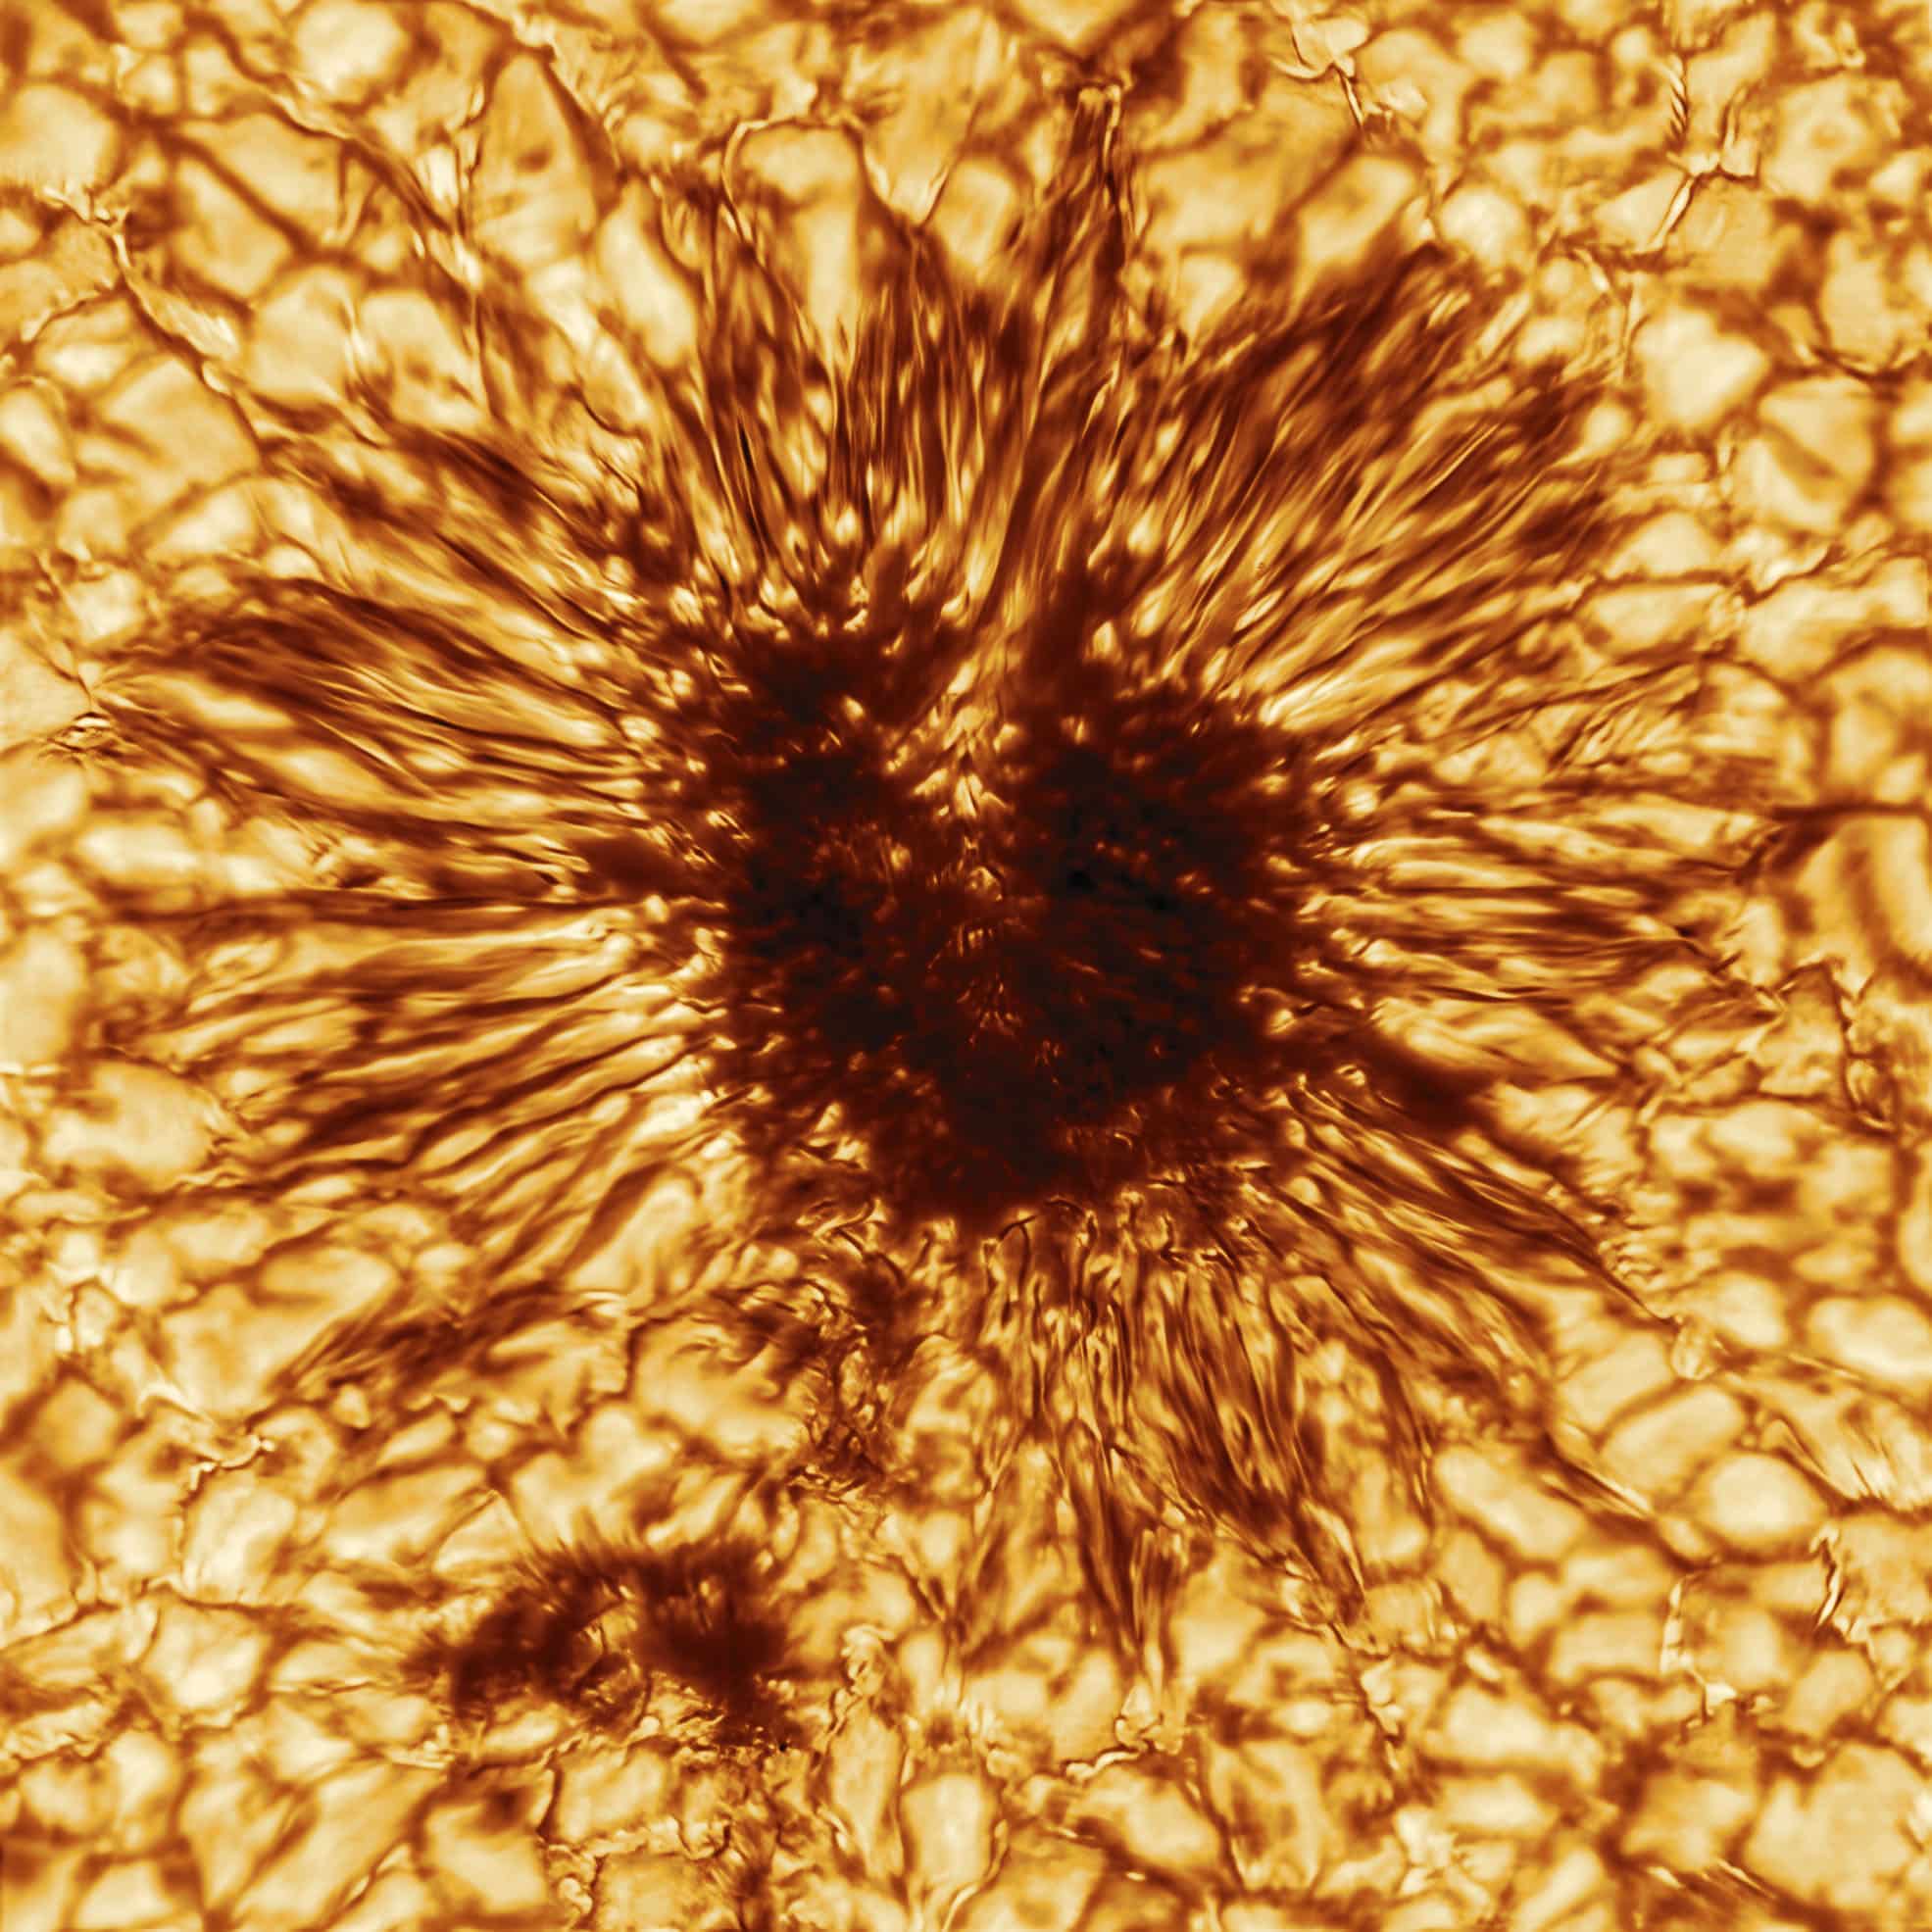
What is clear is that the activity does herald the next maximum. As in the past few months, the sunspots in August all had polarities that assigned them to the new maximum. While it is not impossible for there to be a handful of sunspots in the next few months that belong to the last maximum, it now appears that the last cycle is pretty much over. We are entering the ramp up to the next maximum, presently predicted by a portion of the solar science community aligned with NOAA to be a weak one.
Above all, the real scientific mystery remains: Scientists do not really yet understand the causes and processes that produce this sunspot cycle. They know without question that it is caused by cycles in the Sun’s magnetic dynamo, but their understanding of the details behind this process remain quite unknown.
Furthermore, the Sun’s importance to the climate on Earth is unquestioned. What we still do not know is its precise influence on long term climate changes. There is circumstantial evidence that it causes cooling and warming of the climate on scales of decades and centuries, but this remains unconfirmed. Once again, our understanding of the details behind the changes in the climate remain quite unknown.
And as always, the devil is in the details.