
The big cliffs of Gediz Vallis on Mars
Click for full image.
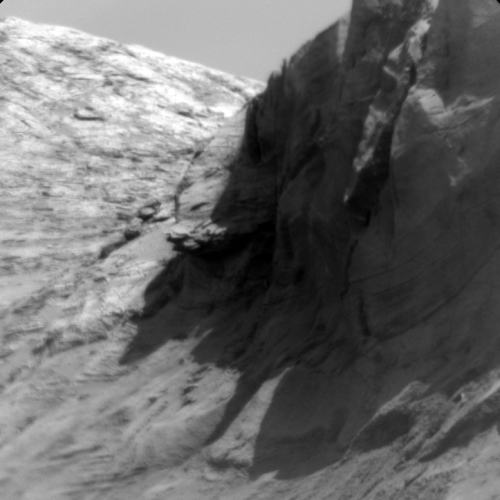
Cool image time! The photo to the right, cropped and reduced to post here, was taken on May 21, 2021 by Curiosity’s chemistry camera (ChemCam), normally designed to look at high resolution close-up imagery of nearby objects.
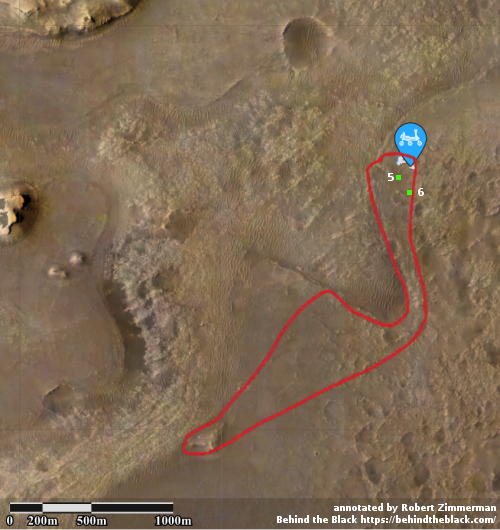
However, it can also be used as what the science team call “a long distance spyglass.” The image to the right is an example, looking at what I think are the distant but steadily approaching big cliffs on the western wall of the canyon Gediz Vallis. Make sure you look close at the shadowed cliff-face, probably several hundred feet high. It is filled with huge rock faces reminiscent of the most stark rock cliffs on the mountains of Earth.
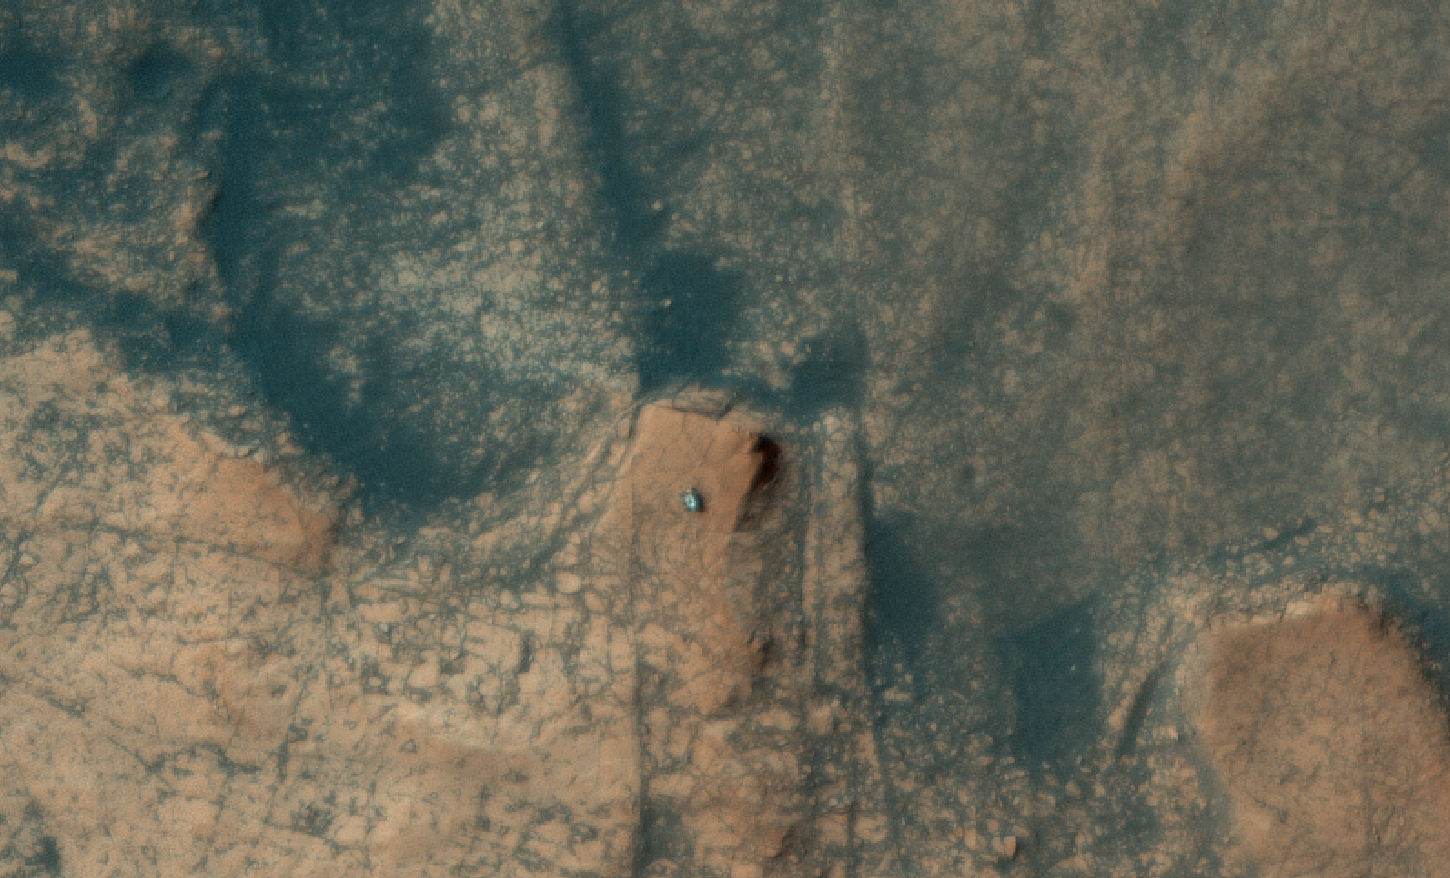
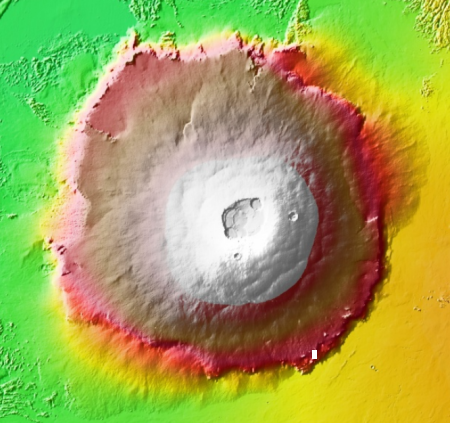
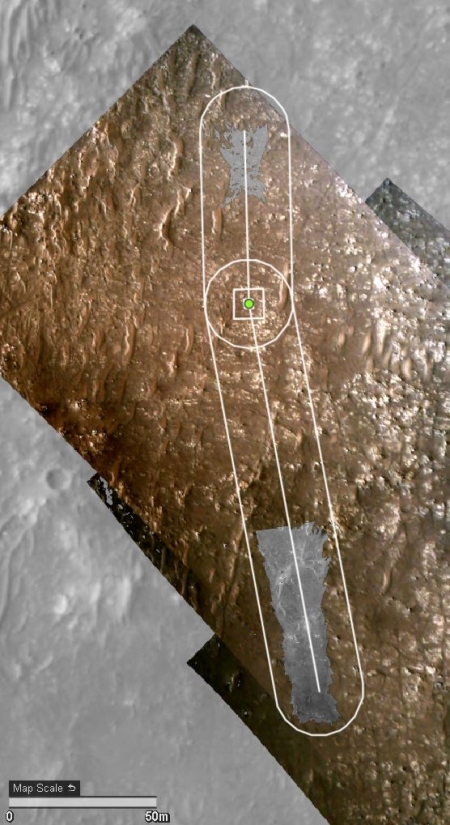
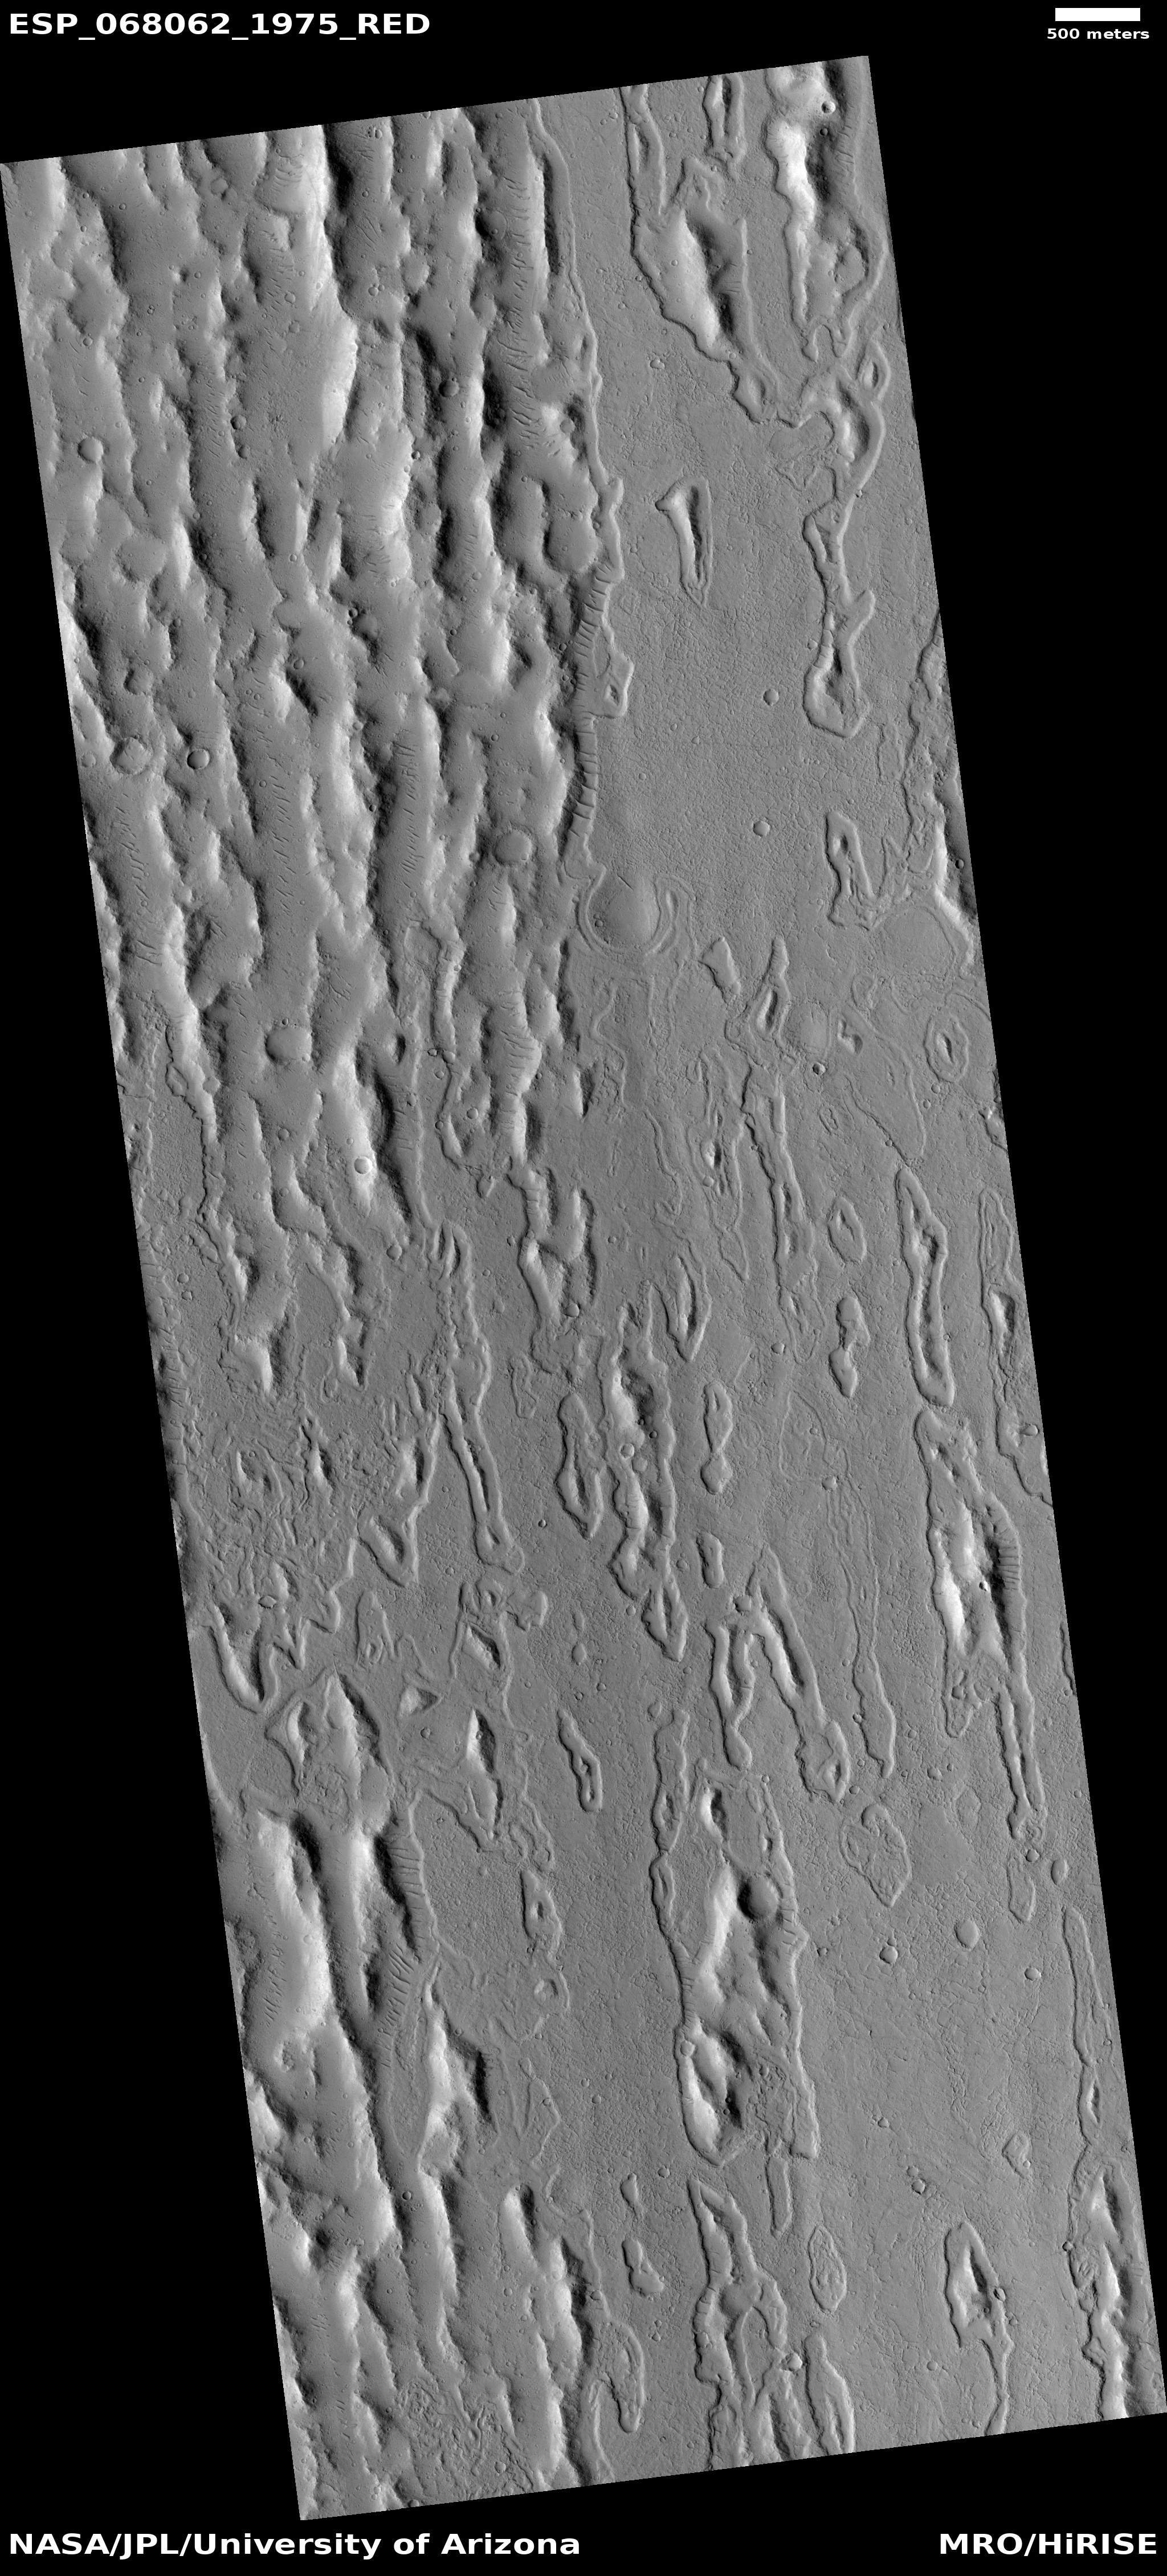
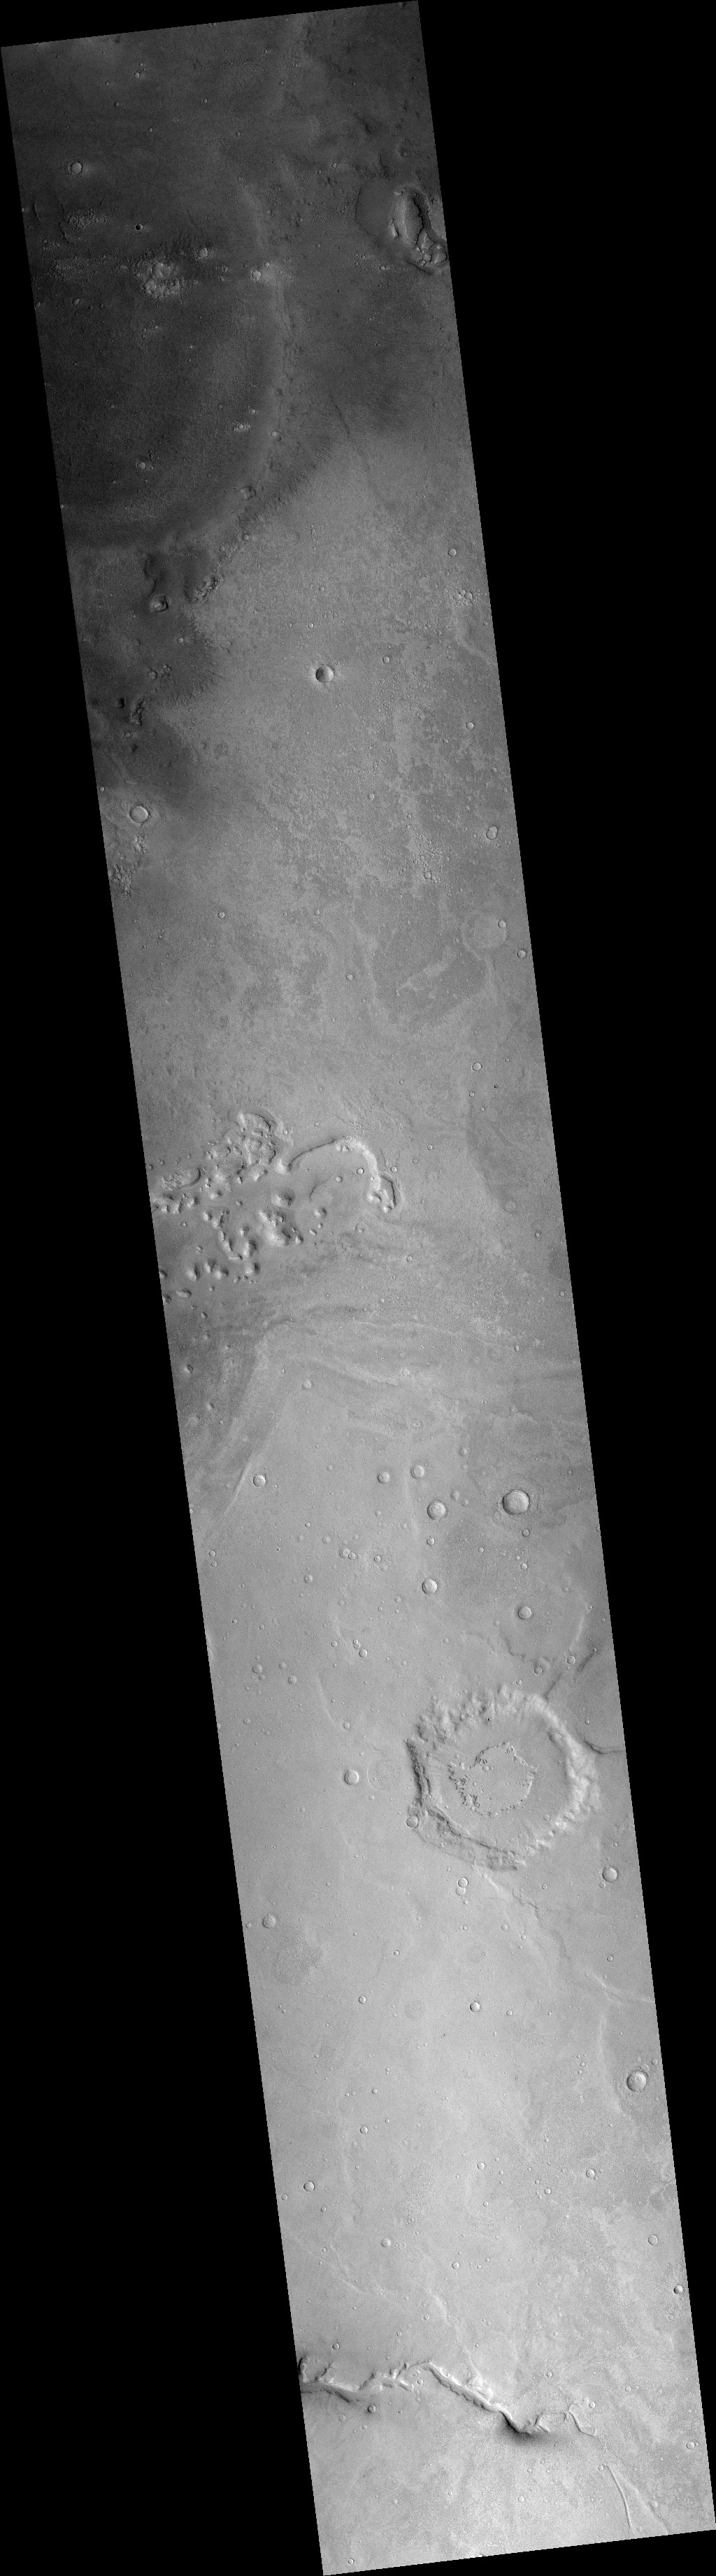
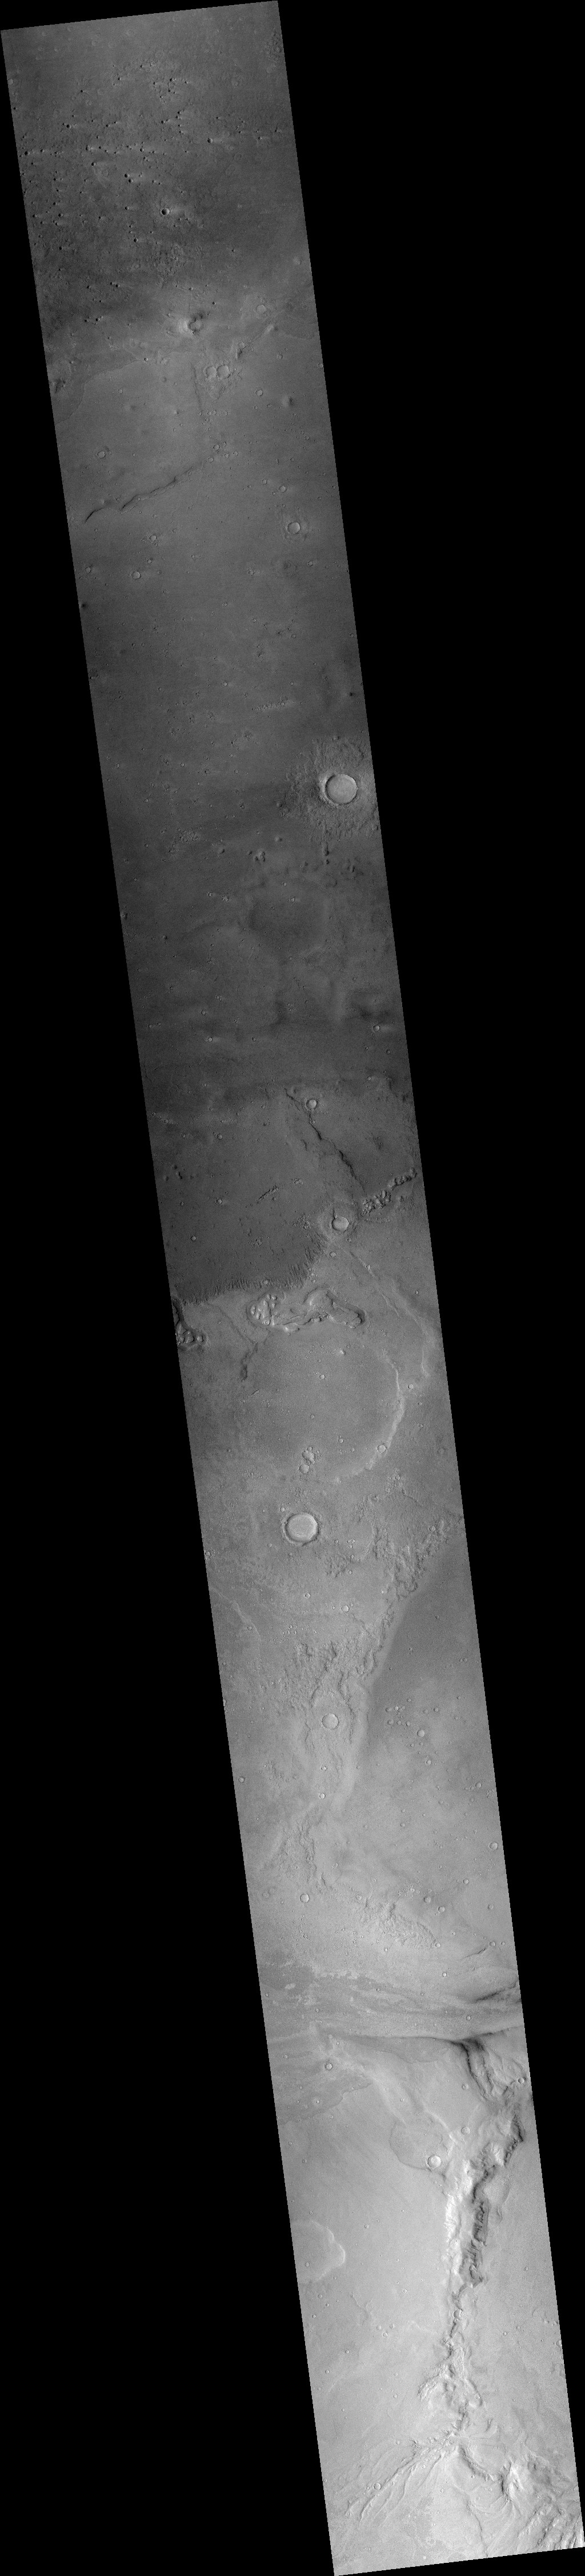
The two images below provide the context, which makes the image even more quite breath-taking.
» Read more
Click for full image.
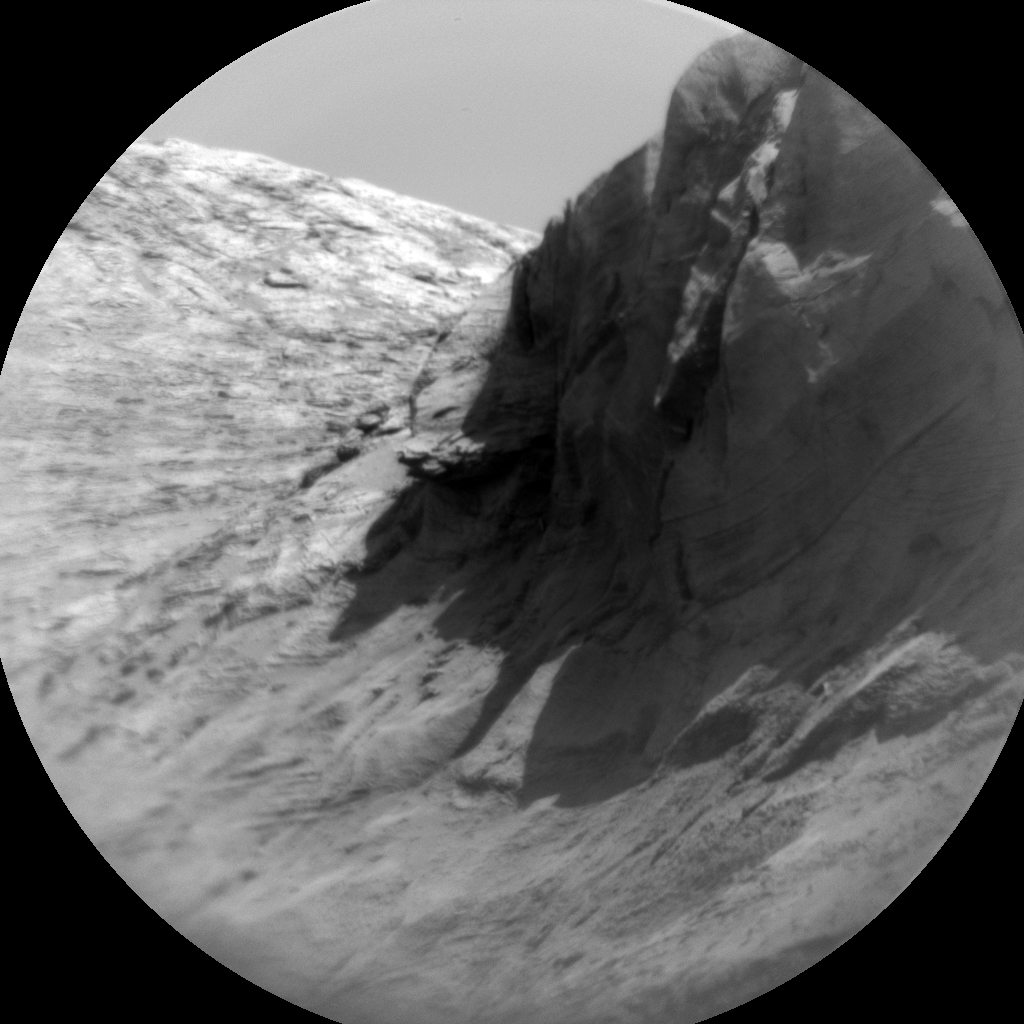
Cool image time! The photo to the right, cropped and reduced to post here, was taken on May 21, 2021 by Curiosity’s chemistry camera (ChemCam), normally designed to look at high resolution close-up imagery of nearby objects.
However, it can also be used as what the science team call “a long distance spyglass.” The image to the right is an example, looking at what I think are the distant but steadily approaching big cliffs on the western wall of the canyon Gediz Vallis. Make sure you look close at the shadowed cliff-face, probably several hundred feet high. It is filled with huge rock faces reminiscent of the most stark rock cliffs on the mountains of Earth.
The two images below provide the context, which makes the image even more quite breath-taking.
» Read more


