A global view of Vesta
The accumulating data from Dawn has now allowed scientists to compile a global picture of the varied surface makeup of the asteroid Vesta.
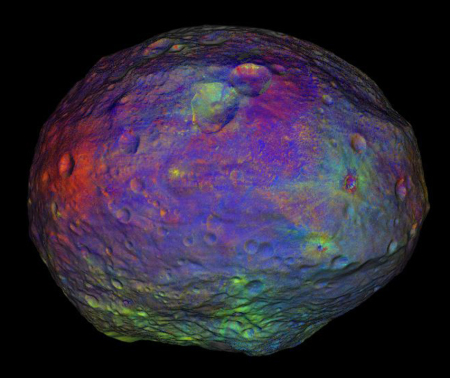
The colors were chosen to highlight differences in surface composition that are too subtle for the human eye to see. Scientists are still analyzing what some of the colors mean for the composition of the surface. But it is clear that the orange material thrown out from some impact craters is different from the surrounding surface material. Green shows the relative abundance of iron. Parts of the huge impact basin known as Rheasilvia in Vesta’s southern hemisphere, for instance, have areas with less iron than nearby areas.
It also makes for a very nice image of the giant asteroid.