Though their definition of what makes a science paper disruptive is open to debate, a review of millions of peer-reviewed papers published since the end of World War II has shown a steady decline in such papers, as if scientists are increasingly unwilling or unable to think outside the box.
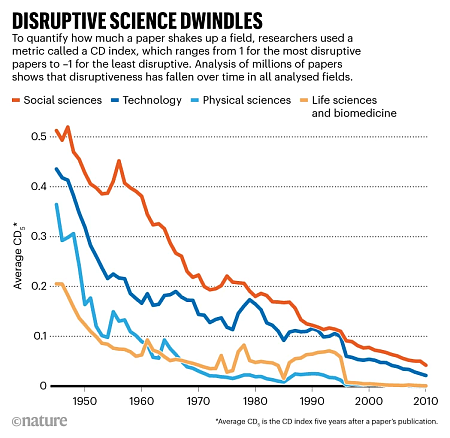
The graph to the right comes from this research.
The authors reasoned that if a study was highly disruptive, subsequent research would be less likely to cite the study’s references, and instead cite the study itself. Using the citation data from 45 million manuscripts and 3.9 million patents, the researchers calculated a measure of disruptiveness, called the ‘CD index’, in which values ranged from –1 for the least disruptive work to 1 for the most disruptive.
The average CD index declined by more than 90% between 1945 and 2010 for research manuscripts, and by more than 78% from 1980 to 2010 for patents. Disruptiveness declined in all of the analysed research fields and patent types, even when factoring in potential differences in factors such as citation practices.
The authors also analysed the most common verbs used in manuscripts and found that whereas research in the 1950s was more likely to use words evoking creation or discovery such as ‘produce’ or ‘determine’, that done in the 2010s was more likely to refer to incremental progress, using terms such as ‘improve’ or ‘enhance’.
The article that I link to above is from Nature, so of course it can’t see the elephant in the room, citing as a possible explanation “changes in the scientific enterprise” where most scientists today work as teams rather than alone.
I say, when you increasingly have big government money involved in research, following World War II, it becomes more and more difficult to buck the popular trends. Tie that to the growing blacklist culture that now destroys the career of any scientist who dares to say something even slightly different, and no one should be surprised originality is declining in scientific research. The culture will no longer tolerate it. You will tow the line, or you will be gone. Scientists are thus towing the line.
To my readers: I had intended to include this paper as part of a larger essay about the general blacklist culture that now dominates American society, but my continuing health issues make it difficult to sit at my desk for long periods. I hope to have things under control in the next few days, but until then my posting is going to continue to be limited.