
Did Quiet Sun Cause Little Ice Age After All?
Did a spotless sun cause the Little Ice Age after all?
Did a spotless sun cause the Little Ice Age after all?
The monthly updated graph for April of the Sun’s solar cycle sunspot activity was posted yesterday by NOAA’s Space Weather Prediction Center. You can see it below.
Though the Sun remained active, you can see that the steep increase in sunspot activity that occurred in March has ceased. At the moment it looks as if the Sun’s sunspot activity is following the most recent scientific prediction, more or less exactly, though the small dip in April puts the numbers slightly below that prediction.
All in all, we still appear to be headed to the weakest solar maximum in two hundred years.

After literally years of inactivity, well below all initial predictions, the Sun truly came to life this past month. Below is the March monthly update of the Sun’s sunspot cycle, published by NOAA’s Space Weather Prediction Center. The red curve is the prediction, while the dotted black line shows the actual activity.
As you can see, the Sun’s sunspot activity shot up precipitously. Though I don’t have the data from past years, the March jump appears to me to probably be one of the fastest monthly rises ever recorded.
Does this mean the newest prediction from the solar scientists at the Marshall Space Flight Center calling for a weak solar maximum in 2013 is wrong? Probably not, though of course in this young field who knows? I would say, however, that the overall trend of the data still suggests the next maximum will be very weak.
Stay tuned! The next few months should finally give us a sense of where the next maximum is heading.

Earlier this week NOAA’s Space Weather Prediction Center published its monthly update of the Sun’s sunspot cycle. As I do every month, I’ve posted the newest graph below, showing the continuing slow rise in sunspots (blue/black lines) in comparison with the consensis prediction made by the solar science community in May 2009 (red line).
» Read more
Did you hear the news? Scientists have solved the mystery of the missing sunspots!
You didn’t? Well, here’s some headlines and stories that surely prove it:
The trouble is that every one of these headlines is 100 percent wrong. The research, based on computer models, only found that when the plasma flow from the equator to the poles beneath the Sun’s surface slows down, the number of sunspots declines.
» Read more
An evening pause: On February 15, 2011, the Sun emitted its strongest flare in four years. Though the Sun continues to act relatively wimpy as it ramps up towards solar maximum, this flare was spectacular, mostly because we now have some amazing instruments in space to image and study it. This video does an excellent job explaining what was happening, as it happened. Watch, and enjoy.
And note, as powerful as this flare was, and despite the fact that it was pointed right at the Earth, it represented a relatively minor threat to our technological society, despite what some doomsayers might be claiming. A very active Sun can cause us problems, especially with power systems and electrical grids, but based on past experience during previous solar maximums, most power companies have taken careful steps to protect themselves from this risk. And with the Sun as weakly active as it is, the risks are further reduced. The doomsayers are simply shilling for more government research dollars.
The sleepy kitten awakes! The Sun released its most powerful solar flare since 2006 last night.
Get those winter coats out of storage! Yesterday NOAA’s Space Weather Prediction Center published its monthly update of the Sun’s sunspot cycle. I’ve posted the newest graph below, showing the continuing slow rise in sunspots (blue/black lines) in comparison with the consensis prediction made by the solar science community in May 2009 (red line).
Though the sunspot count made a slight recovery in January, it was not enough to make up for the plunge in December. Essentially, the Sun continues to act like a sleepy kitten that really doesn’t want to wake up. This suggests that even the newest and wimpiest prediction for the next solar maximum, from solar scientists at the Marshall Space Flight Center, is still overstating the Sun’s upcoming sunspot activity.
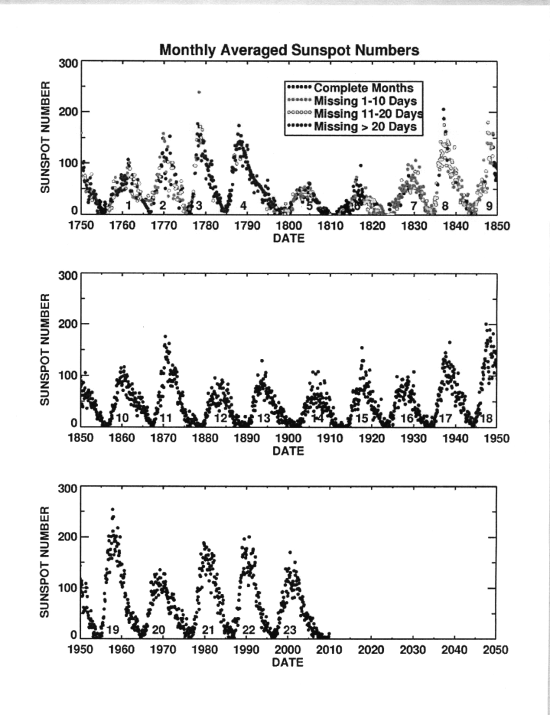
In the past a wimpy Sun has been linked to cold weather, for reasons that scientists as yet don’t quiet understand. And this next solar maximum continues to look like the wimpiest in more than 200 years (see the graph on this page)!

Solar scientists at the Marshall Space Flight Center have once again revised downward their prediction for the intensity of the next solar maximum. Key quote:
Current prediction for the next sunspot cycle maximum gives a smoothed sunspot number maximum of about 59 in June/July of 2013. We are currently two years into Cycle 24 and the predicted size continues to fall.
If this prediction holds, the upcoming solar maximum could be the lowest since the cycle came back to life in around 1715 following the Maunder Minimum.
For today, and today only, the Sun was blank. This blankness ended, however, when a sunspot rotated into view from the far side.
As I asked the last time the Sun was blank in December, will this be the last blank day of the just-ended but very prolonged solar minimum?
The monthly update of the Sun’s developing sunspot cycle was published tonight by NOAA’s Space Weather Prediction Center. You can see the newest graph below, which shows the slow rise in sunspots (blue/black lines) in comparison with the consensis prediction made by the solar science community in May 2009 (red line).
Not only does the Sun’s generally quiet trend continue, its activity took an additional plunge in December, dropping significantly from the previous month. This drop is probably due to the seven days of no sunspots that took place in mid-December.
All in all, we continue to head for the weakest maximum in two hundred years (see the graph on this page), which in the past meant very cold weather. Though scientists do not yet understand why the Sun does this or how these changes in solar activity influence the climate as much as they do, that this in now happening at a time when we have the technology to truly study it is an opportunity that must not be missed.

Though I have been saying that the Sun’s lack of sunspots the last two years suggests the possibility of that we might be facing an extended period without solar activity, I am not a solar scientist. Today, in a paper published today on the Los Alamos astro-ph website, a solar scientist says just that. Key quote:
One method that has yielded predictions consistently in the right range during the past few solar cycles is that of K. Schatten et al., whose approach is mainly based on the polar field precursor. The incipient cycle 24 [on-going right now] will probably mark the end of the Modern Maximum, with the Sun switching to a state of less strong activity.
After six blank days, the Sun is once again showing spots. As I have mentioned several times in 2010, this might be the last time the Sun is blank for years to come as it ramps up to solar maximum. However, don’t bet on it, as the Sun’s activity has been way below all predictions. The upcoming solar maximum might very well be the first in centuries with blank days interspersed throughout.
Apropos my post yesterday on the sunspot cycle: A Dalton Minimum repeat is shaping up.
For the first time since October 10, and only the third time since August, the Earth-facing side of the Sun is blank, showing no sunspots. All told, 2010 has only been blank 13% of the time, for a total of 46 blank days, with only 12 days left in the year. These numbers contrast sharply with 2009, when the Sun was blank 71% of the time, or 260 out of 365 days.
It is very clear that the solar minimum is now over, and that the Sun ramping up to its next maximum. Blank days should soon cease (today might very well be the last for years), and the number of sunspots should continue to increase through approximately 2013, when astronomers now expect the maximum to peak.
It will be a weak maximum, however, likely accompanied with cold weather. At least, this has been the pattern for the last ten centuries, based on the best data that scientists have. When the Sun produces sunspots, the Sun gets hotter, and though that increase in radiation appears slight, it seems enough to warm the Earth’s climate. This is what appears to have happened around the year 1000, during what climate scientists call the Medieval Warm Period.
And when the Sun goes blank, or produces fewer sunspots, the Sun dims, and the Earth’s climate cools. This is what happened in the 1600s and 1700s, when the Little Ice Age gripped much of the Earth. It also happened in the first two decades of the 1800s, the last time the Sun produced as few sunspots as it is now, and when at least one year was called “the year without a summer”. Interestingly, that cold period at the beginning of the 1800s was also a period of intense volcanic activity, which threw a lot of dust and material into the atmosphere and thus helped contribute to the cooling of the Earth.
The last half of the 20th century, however, has not seen that much volcanic activity, which has made the atmosphere today clearer than any time in the past five decades. It has also been a time of increased solar activity, with most of the solar maximums peaking at generally higher numbers. No wonder scientists have detected evidence of a slight warming in the climate.
However, that warming appears to be ending, and it is doing so at the same time the Sun is going spotless. Though we don’t yet fully understand the mechanics of how these two events are linked, it behooves us to pay close attention. No climate prediction or computer model will mean anything if it does not.
Meanwhile, solar scientists remain unclear about the causes behind the solar cycle’s ebbs and flows. They have a reasonable idea that the cycle is caused by the Sun’s magnetic dynamo as it flips from one polarity to another. But why this happens is still subject to debate.
More importantly, it remains a complete unknown how long the next sunspot minimum will be. The Sun could spring back to life, as it did in the 1850s, producing lots of sunspots. Or sunspots might fade out for a few additional decades, as they did in the 1600s.
Sadly, based on the state of our science today, this is a question that probably no one will be able to answer — until we actually see it happen.
NOAA’s Space Weather Prediction Center today published its monthly update of the Sun’s developing sunspot cycle (see below). The graph shows the slow rise in sunspots (blue/black lines) in comparison with the consensis prediction made by the solar science community in May 2009 (red line).
As I noted last month, the rise in sunspots as we ramp up to the next solar maximum has definitely slowed, which indicates clearly that we are heading towards the weakest solar maximum in more than two centuries. And as I have noted repeatedly on this website as well as on the John Batchelor Show, that means very cold weather!
NOAA’s Space Weather Prediction Center today published its monthly update of the Sun’s developing sunspot cycle, showing the slow rise in sunspots in comparison with the consensis prediction made by the solar science community in May 2009.

Unlike October graph, which showed a clear jump in sunspot activity, this November update shows that the rise in sunspot numbers has once again slowed down. As I’ve noted repeatedly, these numbers suggest that we are heading for the weakest solar maximum in two hundred years, far below predictions. And when that last happened, around 1810, it was called the Dalton minimum and the Earth experienced one of its coldest periods in many many decades.
After a three day stretch of blankness, a new sunspot has appeared on the Sun. The question remains: Have we now seen the last blank day for the just ending solar minimum?
The science is settled? According to one scientist’s data, the Sun actually brightened in visible wavelengths during the ramp down from solar maximum to minimum in 2004-2007 — the exact opposite to what was expected — while dropping in the ultraviolet four times more than predicted.
Yesterday NOAA’s Space Weather Prediction Center published its October monthly graph, showing the sun’s developing sunspot cycle in comparison with the consensis prediction made by the solar science community in May 2009.
Sunspot activity in September clearly jumped, though it still remains far below predictions. Prepare for the weakest solar maximum since the 1810s!
Note also that today the Sun is blank, with no sunspots, the first time this has happened since August. At that time I speculated that this might “be the last time the Sun will be blank for years as it continues to ramp up to its next solar maximum.” Obviously not. The question now is whether today will be the finale in blankness for this minimum.