The floor of Marineris Valles

Close-up of the floor of Marineris Valles

Larger view
Click for the full image.

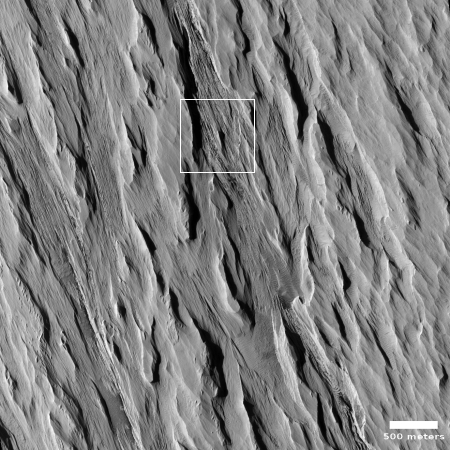
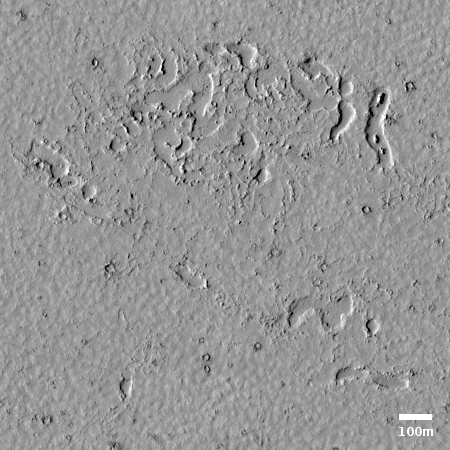
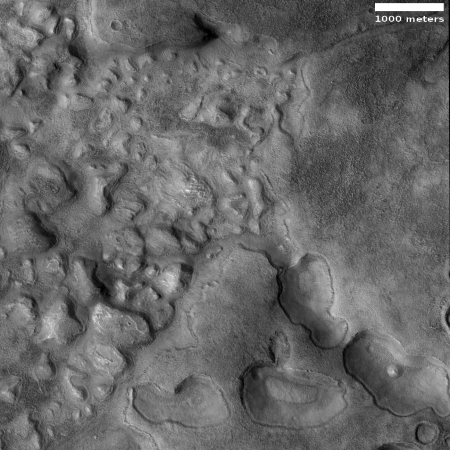
To the right is small section cropped out of an image, taken by the high resolution camera of Mars Reconnaissance Orbiter (MRO) on March 30, 2019, of one very tiny area of the floor of the 2,500 mile long Marineris Valles, the biggest known canyon in the solar system.

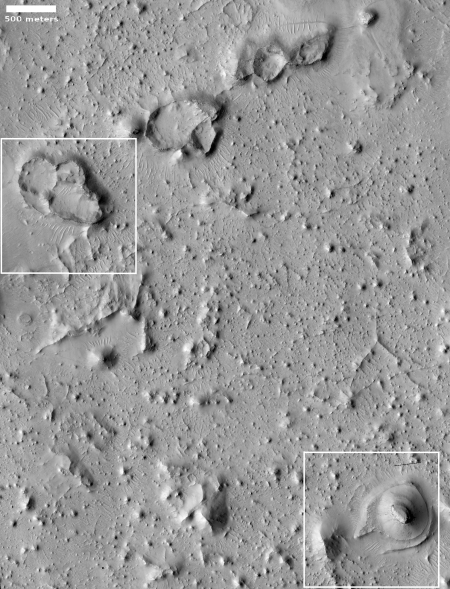
Below this on the right is a larger section of the full image, with the white box showing the part covered by the top photograph. The general flow direction is to the east.

The photograph, uncaptioned, is titled “Terminus of Pitted Materials Emanating from Oudemans Crater.” Oudemans Crater is about 55 miles across and is located near the head of Marineris Valles to the east of the giant volcanic region dubbed the Tharsis Bulge. The meteorite that caused this crater is estimated to have been a little less than 3 miles in diameter. It is believed by some scientists that the impact heated up subsurface carbon dioxide permafrost which then explosively flooded down the Valles Marineris into the Northern Plains of Mars, pushing a lot of pulverized debris in front of it..

Instead of liquid water, what is stored underground on Mars is liquid CO2 and when a collapse occurs, this boils almost instantly and explosively to CO2 vapour, blasting the rock and regolith to dust, except for the most resistant fragments such as igneous rocks. The rest of the regolith is composed of dust and gravel, weakly cemented by water ice. On Mars, water is not a fluid, but behaves as a mineral in most situations. Grains of ice would be tumbled along in the cryogenic flows, and transported as passive solids just like quartz grains are transported as sand by rivers on Earth.

This theory, if correct, would eliminate the need for liquid water on the surface, and would explain many of the planet’s geological surface features.

Overview

The overview thumbnail to the left shows the location of both Oudemans Crater and this MRO image, indicated by the very tiny blue rectangle near the thumbnail’s center..

The “pitted materials” in the image’s title refers to that flowing avalanche of pulverized ice, rock, and dust, shown in the picture by the curved terraced cliffs descending to the east. This is where this material settled as it flowed eastward, pushed by that explosive CO2 flood.

You can see another example of this eastward flow in another MRO image taken just to the west. The canyon floor is pitted, confused, and rough, but there is an obvious flow trend to the east.

In fact, much of the floor of Marineris Valles that has been photographed at high resolution is similarly rugged. It will be a challenge to explore this place, especially because we have only imaged a small percentage at high resolution. There is much there that remains unseen and unknown.

Fractured and collapsed Martian crater floor

Fractured and collapse Martian crater floor
Click for full image.

Time for some puzzling Martian geology. The image on the right, rotated, cropped, and reduced to post here, comes from the Mars Reconnaissance Orbiter (MRO) high resolution archive, and shows a strangely collapsed and fractured crater floor. In fact, like a number of other Martian craters, rather than having a central peak, the center of the crater floor, shown at the image’s center right, seems depressed.

The crater is located in a region dubbed the Cerberus Plains, in a hilly subregion called Tartarus Colles. Of the transition zone between the northern lowlands and the southern highlands these plains comprise the second largest region.

Being in the transition zone I would guess that the geology here is strongly influenced by the ebb and flow of the slowly retreating intermittent ocean that is thought to have once existed in the nearby lowlands. As water came and went, it created a variety of shoreline features scattered about, but not in a single sharp line as we would expect on Earth. Think more like tidal pools, where in some areas water gets trapped and left behind only to sublimate away at at later time.

We can see some hints of these processes in the images of the floors of two other craters that I have previously highlighted, here and here.

With this geological overview in mind, the broken plates here remind me of features I’ve seen in caves. Mud gets washed into a passage, partly filling it. Over time a gentle water flow over the surface of the mud deposits a crust of calcite flowstone on top of the mud. Should the water flow suddenly increase, it will wash out the mud below the crust. If the crust is not very strong or thick, it will crack into pieces as it falls, and thus resemble what we see here in this Martian crater.

There are cases where the crust becomes thick enough to remain standing, which produces some spectacular hanging calcite draperies that seem to defy explanation.

The collapse in the center of the crater is more puzzling, but suggests, based on comparable-looking Earth geology, that any perched water in this canyon might have actually drained out through underground drainage, accessed through the depression.

Be warned: All my explanations above are based on what exists on Earth, and Mars is very different from Earth. The lower gravity, colder temperatures, and different chemistry guarantee that the geological processes there will not be identical. We start by using what we know here, but recognize that we need to learn more about Mars to truly understand what goes on there.

The temperature on Phobos

The temperature on Phobos
Click for full image.

The Mars Odyssey science team today released false color images of the Martian Moon Phobos showing the temperature range that the spacecraft has detected, shown above in a reduced form.

The April 24, 2019 image is the first time Mars Odyssey had gotten a full moon look at the Moon. Not surprisingly, the hottest spots on the surface are at the center, at noon, with it getting cooler as one gets to the outer edges near dawn and dusk and at the poles.

The temperature on Bennu

The OSIRIS-REx science team have released a short movie, compiled from data obtained in November 2018 as the spacecraft was first approaching the asteroid Bennu, that shows the dayside surface temperature and how it changes as the asteroid rotates.

I have embedded the movie below the fold.

Within a distance of only about 850 feet the temperature rises more than 270 degrees, from -99.67 °F to 170.33 °F. This change also occurs at every spot as the asteroid rotates. At dawn it will be that cold, and by noon it will be that hot.
» Read more

Sunspot update April 2019: Not quite minimum

Time for the monthly sunspot update: NOAA yesterday released its the monthly update for the Sun’s sunspot cycle, adding sunspot activity for April 2019 to its graph. As I do every month, I have annotated that graph to give it some context and am posting it below.

While the Sun is clearly at the beginning of what might be an extended or very extended solar minimum, the continuing uptick in activity in both March and April illustrates that we have still not arrived at full minimum.

April 2019 sunspot activity

The graph above has been modified to show the predictions of the solar science community for the previous solar maximum. The green curves show the community’s two original predictions from April 2007, with half the scientists predicting a very strong maximum and half predicting a weak one. The red curve is their revised May 2009 prediction, extended in November 2018 four years into the future.

As the Sun ramps down to minimum it will have months where there is no activity, as happened in February 2019, and months, such as in March and April, where more sunspots appear.

Eventually the quiet months will become dominate, and soon thereafter, when activity increases again (assuming it does), the solar science community will then announce the date of true minimum.

We are not there. Normally it can take a year or more for the Sun to settle down. If activity declines as indicated by the red curve, it could take as long four years, which would be a record-long minimum. The difference will tell us whether the eleven-year solar cycle is continuing, or the Sun is heading into a grand minimum, with no significant sunspots for decades.

And as I have said repeatedly in the past five years, a grand minimum could significantly impact the global climate, cooling it. Or not. It is that unknown that will be answered should a grand minimum occur. Circumstantial data suggests an inactive Sun cools the planet, and the arrival of a new grand minimum will allow scientists to confirm or refute that circumstantial data.

Bennu from two miles

Bennu from two miles
Click for full image.

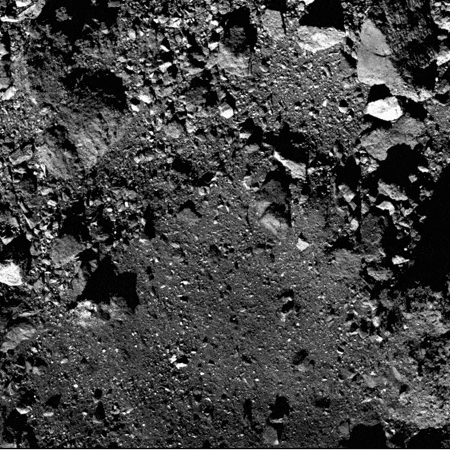
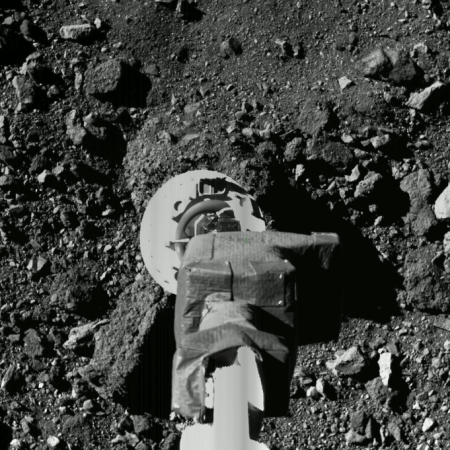
In late March OSIRIS-REx completed its fourth fly-by of the asteroid Bennu. The image on the right, cropped and reduced to post here, was taken when the spacecraft was only 2.1 miles above the surface. If you were standing among these large boulders, we could easily see you.

The image itself shows the asteroid’s southern limb, and thus the shadows are accentuated. This makes it easier to see surface details. Though it is clear once again that Bennu is a pile of boulders and rocks cemented together and floating in space, the photograph also shows that it also has areas where the material is either much larger or fused together more solidly, as shown by the more massive sections in the left center of this picture. We might be looking a very large boulders peeking up from below the surface, or possibly this is the hint of some real bedrock.

The OSIRIS-REx team is continuing the spacecraft’s survey phase, gathering high resolution images in order to compile a detailed map of the surface, prior to planning the touch-and-go sample grab.

More gravitational waves detected

Using the LIGO and Virgo gravitational wave telescopes astronomers have detected two more gravitational waves.

On April 25, 2019, one of the twin LIGO instruments and the Virgo detector observed a candidate signal which – if confirmed – would be the first binary neutron star merger during the third observation run, which began on April 1. A second candidate signal was seen on April 26, which – if confirmed – could be a never-observed-before collision of a neutron star with a black hole. The latter candidate was observed by both LIGO instruments and the Virgo detector. Dozens of telescopes on the Earth and in space are searching for electromagnetic or astro-particle counterparts. No identification with an electromagnetic transient signal nor a host galaxy has been made to date for either candidate.

The resolution of LIGO and VIRGO are somewhat limited, so other telescopes have to scan a very large part of the sky to spot a counterpart. It is therefore likely that it will be years before the first counterpart event is identified. When it is however it will tell us how far away the event was and confirm what kind of event it was. Right now, they are only making educated guesses.

Satellites map out Earth’s Great Whirl

Using more than two decades of satellite data scientists have mapped out the yearly evolution of the
Great Whirl, a gigantic weather formation that routinely forms off the coast of Somalia each year, lasts for more than half the year, and is closely linked to India’s annual monsoon season.

Using 23 years of satellite data, the new findings show the Great Whirl is larger and longer-lived than scientists previously thought. At its peak, the giant whirlpool is, on average, 275,000 square kilometers (106,000 square miles) in area and persists for about 200 days out of the year.

More than being just a curiosity, the Great Whirl is closely connected to the monsoon that drives the rainy season in India. Monsoon rains fuel India’s $2 trillion agricultural economy, but how much rain falls each year is notoriously difficult to forecast. If researchers can use their new method to discern a pattern in the Great Whirl’s formation, they might be able to better predict when India will have a very dry or very wet season compared to the average.

Below the fold is a short video showing the Whirl’s behavior during 2000. It appears that the Great Whirl is an atmospheric eddy formed by the prevailing east winds as they hit the coast of Somalia.
» Read more

X-37B passes 600 days in orbit

One of the Air Force’s two X-37B reusable mini-shuttles has now passed 600 days in orbit.

At this moment this is third longest X-37B mission. However, if the mission lasts four more months it will become the longest.

The article states that it is “unclear” what the mission’s overall purpose is, though we do know that some onboard experiments are testing the ability of some technology to function for long periods in space. I suspect that the spacecraft itself is testing this. When it returns they will look at it closely to see if its design was sufficient for it to do long multi-year missions and then go back to do it again. Moreover, knowing how to build such a craft is essential for building interplanetary spaceship that carry humans to and from the planets.

Lunar eclipse meteorite hit the Moon at almost 38,000 mph

By analyzing the data obtained of the meteorite impact that hit the Moon during the January 21 lunar eclipse, astronomers now estimate it crashed into the surface at almost 38,000 miles per hour and would have produced a crater about 50 feet across.

They also estimate that the meteorite itself had a mass of about 100 pounds with a diameter of between one to two feet.

The new crater itself has not yet been spotted, and probably can only be photographed with the high resolution camera on Lunar Reconnaissance Orbiter (LRO). I expect the LRO science team has already scheduled observations for this location. It will be interesting to see if the actual crater corresponds to the estimates of these astronomers.

New Hubble data baffles cosmologists about universe’s expansion rate

The uncertainty of science: New and very firm data from the Hubble Space Telescope on the universe’s expansion rate conflicts with just-as-firm data obtained by Europe’s Planck astronomical probe.

According to Planck, the present universe should be expanding at a rate of 67 kilometers per second per megaparsec. According to Hubble, the actual expansion rate is 74 kilometers per second per megaparsec.

And according to the scientists involved, both data sets are reliable and trustworthy, leaving them baffled at the difference.

“This is not just two experiments disagreeing,” explained [lead researcher and Nobel laureate Adam Riess of the Space Telescope Science Institute (STScI) and Johns Hopkins University, in Baltimore, Maryland.] “We are measuring something fundamentally different. One is a measurement of how fast the universe is expanding today, as we see it. The other is a prediction based on the physics of the early universe and on measurements of how fast it ought to be expanding. If these values don’t agree, there becomes a very strong likelihood that we’re missing something in the cosmological model that connects the two eras.”

Ya think? Any cosmologist who claims we really understand what is going on, based on our present fragile and very limited knowledge, is either fooling him or herself or is trying to fool us.

I should note that there seems to be an effort, based on the press release above as well as this second one, to downplay the amount of uncertainties that exist in this cosmological work. Both releases fail to note that when scientists announced their first expansion rate estimate from Hubble’s first data back in 1995, those scientists claimed with absolute certainty that the expansion rate was 80 kilometers per second per megaparsec. At the time some scientists, led by the late Allan Sandage of the Carnegie Observatory, disputed this high number, claiming the number could be as low as 50. Some even said it could be as low as 30 kilometers. Sandage especially found himself poo-pooed by the cosmological community for disputing that the 80 number pushed by Hubble’s scientists in 1995.

In the end, the Hubble scientists in 1995 were closer to today’s Hubble number than Sandage, but his estimate was not wrong by that much more, and he was right when he said the number had to be lower. Either way, Hubble’s modern estimate of 74 for the present expansion rate is very well constrained, and is a far more trustworthy number than previous estimates.

However, do we know with any reliability what the expansion rate was billions of years ago? No. Cosmologists think it was faster, based on supernovae data, which is where the theory of dark energy comes from. It is also where Planck’s predictions come from.

That early expansion rate, however, is based on such tentative data, containing so many assumptions and such large margins of error, that no serious scientist should take it too seriously. It suggests things, but it certainly doesn’t confirm them.

This is why their faith in the numbers derived from Planck puzzles me. It is based on a “prediction,” as Riess admits in the quote above, which means it is based on a theoretical model. It is also based on that very tentative early supernovae data, which makes it very suspect to me.

The Hubble data is real data, obtained by looking at nearby stars in a very precise matter. Its margin of error is very small. It contains only a few assumptions, mostly involving our understanding of the Cepheid variable stars that Hubble observed. While skepticism is always called for, trusting this new Hubble data more is perfectly reasonable.

In the end, to really solve this conflict will require better data from the early universe. Unfortunately, that is not something that will be easy to get.

Hayabusa-2 confirms man-made crater on Ryugu

In a planned fly-over of Ryugu yesterday Hayabusa-2 took its first direct images of the location where it had fired an explosive projectile and thus confirmed the creation of a man-made crater by that projectile.

“The asteroid’s terrain has clearly been altered,” said Yuichi Tsuda, an associate professor at the Japan Aerospace Exploration Agency.

Hayabusa2, which began its descent toward the asteroid Wednesday afternoon, captured images of its surface to determine the existence of the crater after it successfully shot a metal projectile at Ryugu on April 5 in an experiment deemed the first of its kind.

According to the JAXA, the probe photographed the area hit by the projectile from a distance of 1.7 km. The agency compared images of the asteroid’s surface before and after the shooting of the projectile to determine the presence of a man-made crater.

They have not yet released any of these images. They will use them however for planning a touchdown and sample grab within this crater in next few months.

Another spectacular landslide found on Mars

Landslide in Hydraotes Chaos
Click for full image.

Cool image time! In perusing the April image release from the high resolution camera of Mars Reconnaissance Orbiter (MRO), I came across the image above, cropped and reduced to post here, of the discovery of another landslide within Hydraotes Chaos, one of the largest regions of chaos terrain on Mars. The image above was taken on February 9, 2019, and has since been followed up with a second image to create a stereo pair.

This is not the first landslide found in Hydraotes Chaos. I highlighted a similar slide on March 11. Both today’s landslide as well as the previous one likely represent examples of gravitational collapses as shown in this science paper about Martian ground water. Some scientists have proposed that Hydraotes Chaos was once an inland sea, and as the water drained away the loss of its buoyancy is thought to cause this kind of landslide at the base of cliffs and crater rims.

The past presence of water also helps explain the soft muddy look of this landslide. When this collapse occurred the material was likely saturated with water. Today it is most likely quite dry and hardened, but when it flowed it flowed like wet mud. Its size, almost a mile long and a quarter mile across, speaks to Mars’s low gravity, which would allow for large singular collapses like this.

Hydraotes Chaos itself is probably one of the more spectacular places on Mars. It sits at the outlet to Marineris Valles, shown in the image below. This gigantic canyon, which would easily cover the entire U.S. if placed on Earth, was the largest drainage from the large volcanic Tharsis Bulge to the west, where Mars’s largest volcanoes are located.
» Read more

First Marsquake recorded by InSight?

The InSight science team has announced that they think they have detected their first Mars quake, though it was too small to provide much information about the Martian interior.

The Martian surface is extremely quiet, allowing SEIS, InSight’s specially designed seismometer, to pick up faint rumbles. In contrast, Earth’s surface is quivering constantly from seismic noise created by oceans and weather. An event of this size in Southern California would be lost among dozens of tiny crackles that occur every day.

“The Martian Sol 128 event is exciting because its size and longer duration fit the profile of moonquakes detected on the lunar surface during the Apollo missions,” said Lori Glaze, Planetary Science Division director at NASA Headquarters.

…Three other seismic signals occurred on March 14 (Sol 105), April 10 (Sol 132) and April 11 (Sol 133). Detected by SEIS’ more sensitive Very Broad Band sensors, these signals were even smaller than the Sol 128 event and more ambiguous in origin. The team will continue to study these events to try to determine their cause.

The data so far suggests is that Mars is far quieter than Earth geologically, but any conclusions at this point would be premature.

UAE’s space agency declares its Mars probe almost ready for launch

The new colonial movement: The space agency of the United Arab Emirates (UAE) today announced that its 2020 Mars orbiter, dubbed Hope, is now 85% complete and on track for making its launch window.

The Probe has already entered an intensive testing phase to ensure its readiness before the launch date, with less than 500 days are remaining for the launch. It is planned to reach Mars by 2021, coinciding with the 50th anniversary of the founding of the UAE.

Several aspects related to the design, assembly of the structure, cameras and control have been verified. So far, the Probe’s systems and components, as well as its ability to communicate with the ground station have been checked by the team. The Probe has succeeded in all the tests it has been subject to so far, ahead of the five environmental tests to be conducted on the probe from June to December 2019.

While this is likely true, we must remain a bit skeptical. Though the link goes to a Reuters Arab news source, the story appears to be entirely a copy of the press release. I know this because five different Arabian news sources used the exact same language in their stories, apparently all copying from the same release.

Thus, we don’t have any independent press in the UAE looking at what is going on here. This could be true, but who knows?

How last year’s global dust storm changed one spot on Mars

One spot on the western flank of  Olympus Mons, August 2017
Click for full image.

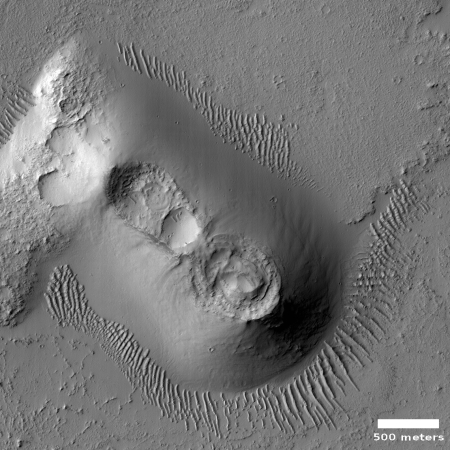
To the right is an image taken by the high resolution camera on Mars Reconnaissance Orbiter (MRO) back in August 2017, cropped, rotated, and reduced to post here. It shows a particular spot on the western slope of the giant volcano Olympus Mons. The uncaptioned image release is entitled “Dark and Possibly Stationary Ripples in Anomalous Terrain.” The image was probably taken as a follow-up to this 2009 image to see if the the dark patches near the peaks and mounds as well as the strange wavy bands of light and dark had changed in eight years. As of 2017 however little had changed. The patches in the 2009 image seem darker, but that is almost certainly due to the lower sun angle causing longer shadows.

The slope goes downhill to the left. The wavy bands are thought to be geological layers exposed by erosion. The cause of the dark patches remain unknown.

I stumbled upon these two early images because of a third new image of this location, taken in February 2019 and spotted by me during my review of April 2019 images downloaded from MRO. That uncaptioned new image was titled “Change Detection in Olympus Maculae.” Had scientists spotted some new volcanic activity at this spot? To find out I dug into the MRO archive at this location and found both the 2009 and 2017 images.

The 2019 image is below. It is cropped, rotated, and reduced to match exactly with the image above in order to highlight any changes that might have occurred.
» Read more

Five exoplanets discovered with orbits from 15 to 40 years long

Twenty years of observations have now resulted in the discovery of five exoplanets with long solar orbits ranging from 15 to 40 years.

“As early as 1998, a planetary monitoring programme was set up and carried out scrupulously by the many … observers [using the EULER telescope belonging to Geneva University, Switzerland,] who took turns every two weeks in La Silla [Chile] for 20 years”, says Emily Rickman. The result is remarkable: five new planets have been discovered and the orbits of four others known have been precisely defined. All these planets have periods of revolution between 15.6 and 40.4 years, with masses ranging approximately from 3 to 27 times that of Jupiter. This study contributes to increasing the list of 26 planets with a rotation period greater than 15 years.

The press release is very poorly written. It does not explain how 21 years of observations pinpointed the orbit of an exoplanet of forty years. I suspect they have seen enough of the star’s wobble to extrapolate that orbit, but the press release should have explained this.

Mercury’s core is solid

By comparing computer models with data gathered during the closest orbits of the Messenger spacecraft when it was in orbit around Mercury scientists have concluded that the planet’s inner core is solid like the Earth’s, though much larger than the Earth’s relative to the planet’s size.

Genova and his team put data from MESSENGER into a sophisticated computer program that allowed them to adjust parameters and figure out what the interior composition of Mercury must be like to match the way it spins and the way the spacecraft accelerated around it. The results showed that for the best match, Mercury must have a large, solid inner core. They estimated that the solid, iron core is about 1,260 miles (2,000 kilometers) wide and makes up about half of Mercury’s entire core (about 2,440 miles, or nearly 4,000 kilometers, wide). In contrast, Earth’s solid core is about 1,500 miles (2,400 kilometers) across, taking up a little more than a third of this planet’s entire core.

All high resolution images from Rosetta now available

The Rosetta science team has now made available to the public all 70,000 images taken by the spacecraft’s high resolution camera.

Between 2014 and 2016, the scientific camera system OSIRIS onboard ESA’s Rosetta spacecraft captured almost 70000 images of comet 67P/Churyumov-Gerasimenko. They not only document the most extensive and demanding comet mission to date, but also show the duck-shaped body in all its facets. In a joint project with the Department of Information and Communication at Flensburg University of Applied Sciences, the Max Planck Institute for Solar System Research (MPS), head of the OSIRIS team, has now published all of these images. The OSIRIS Image Viewer is suited to the needs of both laymen and expert and offers quick and easy access to one of the greatest scientific treasures of recent years.

The Rosetta archive can be found here.

Seasonal frost in a gully on Mars

Frost in a gully on Mars
Click for full image.

Cool image time! The photo on the right, cropped, reduced, and brightened slightly to post here, was part of the April image release from the high resolution camera on Mars Reconnaissance Orbiter (MRO). According to the titled of this release, it purports to show visible frost on what looks like an avalanche debris slope on the rim of a large crater. The frost is the bright streaks on the upper left of the slope.

I wonder. During last month’s 50th Lunar and Planetary Science Conference in Texas, there was one paper that I reported on that showed something very similar to this, and proposed that white streaks like this in a gully were actually exposed snow/ice. They proposed that the snow/ice was normally covered by dust, and the white streaks were where the dust had blown away to reveal the ice below. This in turn would then sublimate into gas, which in turn would cause the gully avalanches over time.

Below is a close-up of the white streaks on this rim.
» Read more

Data from Cassini’s last fly-by of Titan

Based on data from Cassini’s last fly-by of Titan, scientists have been able to estimate the depth of some of that planet’s northern lakes while also finding that they were filled mostly with methane.

The depths measured were as much as 300 feet. The data also shows that the geology of one hemisphere in the north was different from the other hemisphere.

On the eastern side of Titan, there are big seas with low elevation, canyons and islands. On the western side: small lakes. And the new measurements show the lakes perched atop big hills and plateaus. The new radar measurements confirm earlier findings that the lakes are far above sea level, but they conjure a new image of landforms – like mesas or buttes – sticking hundreds of feet above the surrounding landscape, with deep liquid lakes on top.

The fact that these western lakes are small – just tens of miles across – but very deep also tells scientists something new about their geology: It’s the best evidence yet that they likely formed when the surrounding bedrock of ice and solid organics chemically dissolved and collapsed. On Earth, similar water lakes are known as karstic lakes. Occurring in in areas like Germany, Croatia and the United States, they form when water dissolves limestone bedrock.

This data also suggests, as has previous data, that Titan could very well have extensive underground cave systems. Unlike the Moon or Mars, however, these are not going to be very hospitable to colonization, considering the presence of methane and the cold temperatures.

Tess finds Earth-sized planet?

Scientists using the space telescope TESS think they may have found its first Earth-sized planet.

Its host star has about 80 percent of the mass of our Sun and is found about 53 light-years distant from Earth. HD 21749b has about 23 times Earth’s mass and a radius of about 2.7 times Earth’s. Its density indicates the planet has substantial atmosphere but is not rocky, so it could potentially help astronomers understand the composition and evolution of cooler sub-Neptune planet atmospheres.

Excitingly, the longer period sub-Neptune planet in this system is not alone. It has a sibling planet, HD 21749c, which takes about eight days to orbit the host star and is much smaller—similar in size to Earth. “Measuring the exact mass and composition of such a small planet will be challenging, but important for comparing HD 21749c to Earth,” said Wang. “Carnegie’s PFS team is continuing to collect data on this object with this goal in mind.”

In other words, they know almost nothing yet about the smaller exoplanet. They think it is similar in size to the Earth, but they don’t know its mass or composition.

Rover update: April 11, 2019

Summary: Curiosity successfully drills into the clay unit. Yutu-2 continues its exploration on the far side of the Moon.

For the updates in 2018 go here. For a full list of updates before February 8, 2018, go here.

Curiosity drill hole in clay unit on slopes of Mount Sharp

Curiosity

For the overall context of Curiosity’s travels, see my March 2016 post, Pinpointing Curiosity’s location in Gale Crater.

The news this week from Curiosity is that the rover has successfully drilled into the ground in the clay unit valley the rover is presently exploring betweent Vera Rubin Ridge and Mount Sharp’s higher slopes.

The image to the right shows is a close-up of that drill hole.

The rover’s drill chewed easily through the rock, unlike some of the tougher targets it faced nearby on Vera Rubin Ridge. It was so soft, in fact, that the drill didn’t need to use its percussive technique, which is helpful for snagging samples from harder rock. This was the mission’s first sample obtained using only rotation of the drill bit.

Since my last rover update on February 20, 2019, they have been traveling for several weeks to get to a spot where they can do this drilling. The clay unit seems very soft, and almost mudlike, which made finding a good surface to drill somewhat challenging. Most of the terrain seemed too soft to drill into. It almost would be better to have a scoop, as the Viking landers had. Curiosity doesn’t really have this however. It needs to use its drill, which really is a more efficient way to get down deeper into the ground anyway.

The map below shows their recent travels.
» Read more

Jupiter’s atmosphere reacts quickly to the solar wind

New data from ground-based telescopes show that the atmosphere of Jupiter quickly changes due to changes in the solar wind, and that these changes descend deeper into the atmosphere than expected.

Auroras at Earth’s poles (known as the aurora borealis at the North Pole and aurora australis at the South Pole) occur when the energetic particles blown out from the Sun (the solar wind) interact with and heat up the gases in the upper atmosphere. The same thing happens at Jupiter, but the new observations show the heating goes two or three times deeper down into its atmosphere than on Earth, into the lower level of Jupiter’s upper atmosphere, or stratosphere.

…”What is startling about the results is that we were able to associate for the first time the variations in solar wind and the response in the stratosphere – and that the response to these variations is so quick for such a large area,” said JPL’s Glenn Orton, co-author and part of the observing team.

Within a day of the solar wind hitting Jupiter, the chemistry in its atmosphere changed and its temperature rose, the team found. An infrared image captured during their observing campaign in January, February and May of 2017 clearly shows hot spots near the poles, where Jupiter’s auroras are.

Considering Jupiter’s size, for these effects to extend so quickly really is startling.

Thumbprints on Mars!

Thumbprints terrain on Mars!
Click for full image.

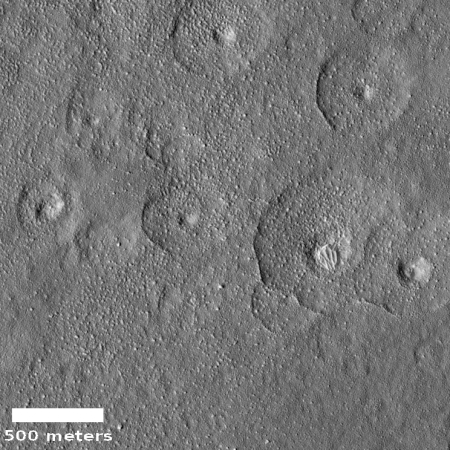
Honestly, don’t ask me. I didn’t come up with the name. I found the image on the right, cropped and reduced to post here, as part of the April image dump from the high resolution camera of Mars Reconnaissance Orbiter. The uncaptioned release dubbed this “Thumbprint Terrain in Northern Mid-Latitudes,” and it is obvious to see why. The cropped image on the right focuses in on the oval white mounds that really do look like some giant child was touching a soft damp muddy surface randomly with his fingers, leaving behind raised fingerprints as the mud stuck to his fingers as he pulled them away.

Each white area seems to have a crater. I suspect these are not impact craters, but possibly mud volcanoes, as each is at the top of a mound. My hypothesis is further strengthened by the location, which is deep within the low northern plains of Mars, a place where some scientists believe an intermittent ocean once existed. These mounds could have easily formed at that ocean’s floor, or thereafter when the land here was drying out.

On the other hand, these could be from impact. Maybe they are scattered ejecta from a larger impact, landing here in a group on a wet muddy surface. The impacts might have concentrated the material around the crater, making it more resistant to erosion, which is why the craters now stand above the floor of the plain.

On the third hand, all these theories could be wrong. Have any of your own?

SpaceX drops protest against NASA launch decision

SpaceX has decided to withdraw its protest against NASA’s decision to choose ULA as the launch vehicle for its Lucy asteroid mission.

The company did not provide any reason for the withdrawal. I suspect Musk decided that it was doing SpaceX harm both publicly and privately. Publicly it threatened the launch date of Lucy, which might cause a significant and fatal delay to the mission. That did not make SpaceX look good to the general public.

Privately, I suspect that the protest was hurting SpaceX with NASA officials. They almost certainly did not say so directly, but I am certain they were able to make this clear in any number of ways. This, combined with the agency’s new willingness to consider commercial rockets, like the Falcon Heavy, for its lunar plans, probably convinced SpaceX that it was doing itself more harm than good with the protest.

Bennu’s cobbled equatorial ridge

Bennu as seen by OSIRIS-REx
Click for full image.

The OSIRIS-REx science team has released a new close-up image of Bennu, this time showing the asteroid’s equatorial ridge. The image on the right is that photograph, reduced to post here.

When the image was taken, the spacecraft was positioned over Bennu’s northern hemisphere, looking southward over the asteroid’s equatorial bulge. The field of view shown is 168 ft (51.2 m) wide. For scale, the bright, rectangular rock above the dark region is 8 ft (2.4 m) wide, about the size of a long bed on a pickup truck

Like Ryugu, the scientists for OSIRIS-REx are going to be challenged in finding a location smooth enough for their touchdown sample grab. That surface reminds me of some avalanche scree slopes I’ve hike across, where you’ve got nothing but rough rocks to walk on.

Parker survives its second close Sun flyby

The Parker Solar probe has survived its second solar flyby, passing within fifteen million miles of the Sun on April 4.

It was moving at 213,000 miles per hour at that moment, which is probably a speed record for any human vehicle. That however is a record Parker will likely break on future fly-bys.

The entire close encounter runs from March 30 to April 10, during which the spacecraft gathers data about the Sun’s inner corona (the sun’s atmosphere).

1 107 108 109 110 111 271