Parker begins second orbit around Sun

The Parker Solar Probe has completed its first full orbit of the Sun and has begun full science operations.

On Jan. 19, 2019, just 161 days after its launch from Cape Canaveral Air Force Station in Florida, NASA’s Parker Solar Probe completed its first orbit of the Sun, reaching the point in its orbit farthest from our star, called aphelion. The spacecraft has now begun the second of 24 planned orbits, on track for its second perihelion, or closest approach to the Sun, on April 4, 2019.

Parker Solar Probe entered full operational status (known as Phase E) on Jan. 1, with all systems online and operating as designed. The spacecraft has been delivering data from its instruments to Earth via the Deep Space Network, and to date more than 17 gigabits of science data has been downloaded. The full dataset from the first orbit will be downloaded by April.

They have been somewhat tight-lipped about any results from the data already obtained. I suspect it has not yet been analyzed fully, and the scientists are reserving comment until they complete their first science papers and get them published.

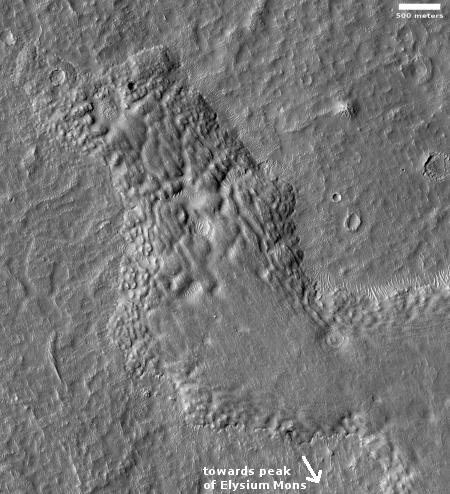
Weird Martian fracture feature

Fractured collapse feature on Mars

Cool image time! When I first looked at the high resolution Mars Reconnaissance Orbiter (MRO) image on the right, my immediate reaction was, “What the heck is that?” The image to the right is cropped and reduced, but if you click on it you can see the full image at high resolution.

The fractured terrain appears to be all within a collapse. To my eye it appears that while the overall surface has sunk, the fractures indicate an area where there has been an eruption upward, which after the eruption collapsed again, so that the fractured area remains at the apparent bottom of the collapse sink. I was immediately reminded of Upheaval Dome in Yellowstone National Park, which some geologists believe was formed by a “salt bubble” rising upward to create a salt dome.

A thick layer of salt, formed by the evaporation of ancient landlocked seas, underlies much of southeastern Utah and Canyonlands National Park. When under pressure from thousands of feet of overlying rock, the salt can flow plastically, like ice moving at the bottom of a glacier. In addition, salt is less dense than sandstone. As a result, over millions of years salt can flow up through rock layers as a “salt bubble”, rising to the surface and creating salt domes that deform the surrounding rock.

Context image for fracture feature

The process and materials involved were certainly different on Mars. Nonetheless, it does appear we are looking at an eruptive feature unrelated to molten lava. The context image to the right, showing this feature’s location in Mars’ vast northern lowlands, also shows that it has occurred on terrain that has bulged upwards relative to the surrounding lowlands. Nearby MRO images also show similar bulge/collapse features.

To decipher the geological mystery here, we would also need to know when this happened and whether there ever was a liquid ocean residing on top of it, before, during, or after the eruption. We also do not know well the make-up of the underground materials, including whether any frozen water and salt is present.

To be honest, we really don’t know much. I am sure a planetary scientist studying this feature could fill us in on some of these details, such as information provided by the colors in the color image. Even so, I am sure any good scientist would also admit to unknowns.

To get some real answers, we need to be there. It is as simple as that.

The absolute uncertainty of climate science

Even as the United States is being plunged right now into an epic cold spell (something that has been happening repeatedly for almost all the winters of the past decade), and politicians continue to rant about the coming doom due to global warming, none of the data allows anyone the right to make any claims about the future global climate, in any direction.

Why do I feel so certain I can make this claim of uncertainty? Because the data simply isn’t there. And where we do have it, it has been tampered with so badly it is no longer very trustworthy. This very well documented post by Tony Heller proves this reality, quite thoroughly.

First, until the late 20th century, we simply do not have good reliable climate data for the southern hemisphere. Any statement by anyone claiming to know with certainty what the global temperature was prior to 1978 (when the first Nimbus climate satellite was launched) should be treated with some skepticism. Take a look at all the graphs Heller posts, all from reputable science sources, all confirming my own essay on this subject from 2015. The only regions where temperatures were thoroughly measured prior to satellite data was in the United States, Europe, and Japan. There are scattered data points elsewhere, but not many, with none in the southern oceans. And while we do have a great deal of proxy data that provides some guidance as to the global temperature prior to the space age, strongly suggesting there was a global warm period around the year 1000 AD, and a global cold period around 1600 AD, this data also has a lot of uncertainty, so it is entirely reasonable to express some skepticism about it.

Second, the data in those well-covered regions have been tampered with extensively, and always in a manner that reinforces the theory of global warming. Actual temperature readings have been adjusted everywhere, always to cool the past and warm the present. As Heller notes,
» Read more

New image of Ultima Thule

Ultima Thule

The New Horizons science team today released the newest and highest quality image yet of the Kuiper Belt object Ultima Thule. The image can be seen by clicking on the slightly reduced and cropped to the right.

Obtained with the wide-angle Multicolor Visible Imaging Camera (MVIC) component of New Horizons’ Ralph instrument, this image was taken when the KBO was 4,200 miles (6,700 kilometers) from the spacecraft, at 05:26 UT (12:26 a.m. EST) on Jan. 1 – just seven minutes before closest approach. With an original resolution of 440 feet (135 meters) per pixel, the image was stored in the spacecraft’s data memory and transmitted to Earth on Jan. 18-19. Scientists then sharpened the image to enhance fine detail. (This process – known as deconvolution – also amplifies the graininess of the image when viewed at high contrast.)

The oblique lighting of this image reveals new topographic details along the day/night boundary, or terminator, near the top. These details include numerous small pits up to about 0.4 miles (0.7 kilometers) in diameter. The large circular feature, about 4 miles (7 kilometers) across, on the smaller of the two lobes, also appears to be a deep depression. Not clear is whether these pits are impact craters or features resulting from other processes, such as “collapse pits” or the ancient venting of volatile materials.

They have only begun downloading the best data and images, so expect better images in the future.

Martian glacier with moraine?

Glacier flow on Mars, with moraine

Cool image time! In the past two decades numerous images and studies of the Martian terrain produced by orbiters have shown us landslides, lava flows, water and ice produced flows, and many glacial features, all vaguely familiar but often having components reminding us of the alien nature of the Martian landscape. I have posted many here at Behind the Black. (Just do a search here for the words “Mars flow” and you will have a wealth of cool images and alien geological features to explore.)

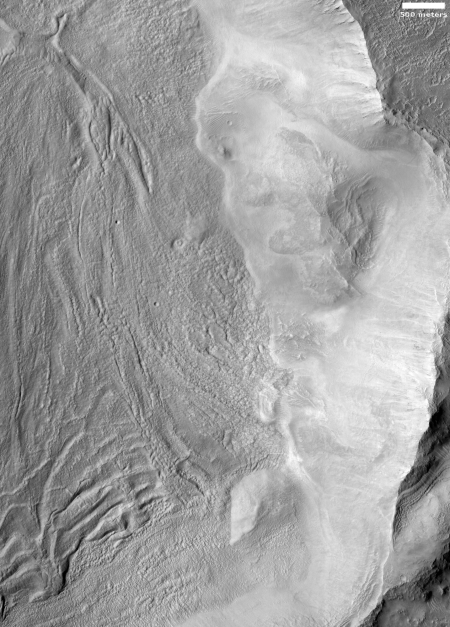
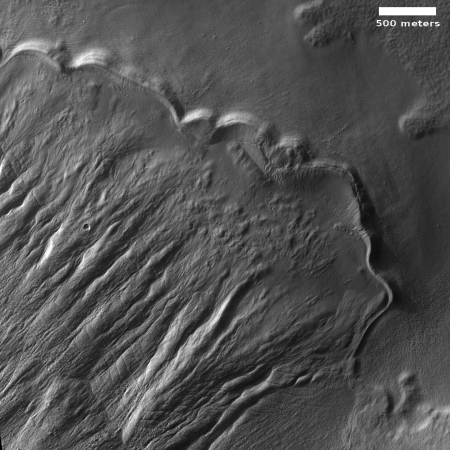
The image on the right, rotated, cropped, and reduced to post here, shows another such feature, but this time it is less alien and more resembling a typical Earth glacier, flowing downhill slowly and pushing a moraine of debris before it. The picture was taken by the high resolution camera on Mars Reconnaissance Orbiter (MRO) and was part of the January image release. If you click on the image you can see the complete photograph at full resolution.

The release has no caption, but is titled “Tongue-Shaped Glacier in Centauri Montes,” referring to the largest tongue-shaped flow on the left. This feature, more than any other in the image, resembles closely many glaciers on Earth. It even has an obvious moraine at its head. As the glacial flow pushed downward slowly it gathered a pile of material that eventually began to act almost like a dam.

The location of this feature is intriguing in its own right.
» Read more

Rock from Earth, found on Moon?

The uncertainty of science: Scientists studying rocks brought back by the Apollo 14 lunar mission have concluded that one sample originally came from the Earth, and if so would be the oldest known Earth rock.

It is possible that the sample is not of terrestrial origin, but instead crystallized on the Moon, however, that would require conditions never before inferred from lunar samples. It would require the sample to have formed at tremendous depths, in the lunar mantle, where very different rock compositions are anticipated. Therefore, the simplest interpretation is that the sample came from Earth.

The team’s analyses are providing additional details about the sample’s history. The rock crystallized about 20 kilometers beneath Earth’s surface 4.0-4.1 billion years ago. It was then excavated by one or more large impact events and launched into cis-lunar space. Previous work by the team showed that impacting asteroids at that time were producing craters thousands of kilometers in diameter on Earth, sufficiently large to bring material from those depths to the surface. Once the sample reached the lunar surface, it was affected by several other impact events, one of which partially melted it 3.9 billion years ago, and which probably buried it beneath the surface. The sample is therefore a relic of an intense period of bombardment that shaped the Solar System during the first billion years. After that period, the Moon was affected by smaller and less frequent impact events. The final impact event to affect this sample occurred about 26 million years ago, when an impacting asteroid hit the Moon, producing the small 340 meter-diameter Cone Crater, and excavating the sample back onto the lunar surface where astronauts collected it almost exactly 48 years ago (January 31–February 6, 1971).

The scientists also admit that their conclusion is controversial and will be disputed. If true, however, it suggests that there is significant material on the Moon from the early Earth that can provide a window into parts our planet’s history that are presently inaccessible.

Oblique close-up image of Ceres

Ceres from Dawn

The Dawn science team has released an oblique close-up image of Ceres, taken in May 2018 before the Dawn mission ended. To the right is a reduced resolution version, with the full resolution photograph viewable if you click on it.

Dawn captured this view on May 19, 2018. The image shows the limb of Ceres at about 270E, 30N looking south. The spatial resolution is about 200 feet (60 meters) per pixel in the nearest parts of the image. The impact crater to the right (only partially visible) is Ninsar, named after a Sumerian goddess of plants and vegetation. It is about 25 miles (40 kilometers) in diameter.

Bright seeps running down the interior rims of several craters are visible. To my eye, the image also suggests an overall softness to Ceres. Its surface is like a sandbox, easily reshaped significantly by each impact.

Orbital images of Bennu

Close-up of Bennu's southern hemisphere

The OSIRIS-REx science team has released two new images of Bennu’s southern hemisphere, taken from orbit. The image on the right is a cropped section of the highest resolution version of a montage of two images. Click on the image to see the entire two-image montage.

These two OpNav images of Bennu’s southern hemisphere, which each have an exposure time of about 1.4 milliseconds, were captured Jan. 17 from a distance of about one mile (1.6 km). They have been cropped and the contrast has been adjusted to better reveal surface features. The large boulder – fully visible in the middle of the left frame and in partial shadow in lower portion of right frame – is about 165 feet (50 meters) across.

The cropped section to the right shows that large boulder in the middle of the frame.

I’m sorry, but when I look at this rubble-pile asteroid I cannot help but think of the cat-litter clumps I remove from our cats’ litter box. The only fundamental difference is that the grains in cat litter are made to be a uniform size, while at Bennu the grains are much coarser and not uniform. Nonetheless, this asteroid is a clump of many grains, just like those cat litter clumps, and will likely crumple easily into a cloud of grains if smacked just hard enough.

This knowledge is actually very critical, as Bennu is a potentially dangerous asteroid with an orbit that might have it impact the Earth in about two hundred years.

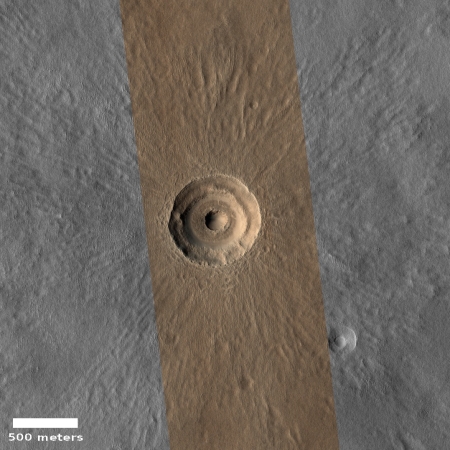
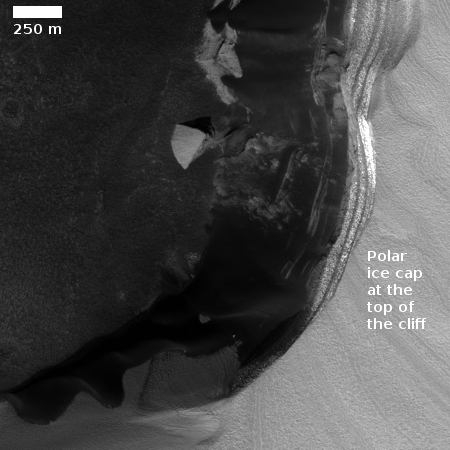
New impact on the Martian south polar cap

New impact on Mars' south pole

Cool image time! The image to the right, cropped to post here, was taken on October 5, 2018 by the high resolution camera on Mars Reconnaissance Orbiter (MRO) and shows a recent meteorite impact that occurred sometime between July and September of 2018 on the Martian polar cap . If you click on the image you can see the entire photograph. As noted in the captioned press release,

It’s notable because it occurred in the seasonal southern ice cap, and has apparently punched through it, creating a two-toned blast pattern.

The impact hit on the ice layer, and the tones of the blast pattern tell us the sequence. When an impactor hits the ground, there is a tremendous amount of force like an explosion. The larger, lighter-colored blast pattern could be the result of scouring by winds from the impact shockwave. The darker-colored inner blast pattern is because the impactor penetrated the thin ice layer, excavated the dark sand underneath, and threw it out in all directions on top of the layer.

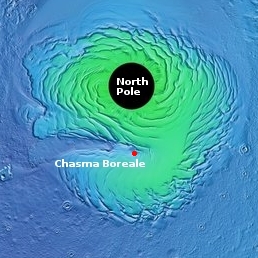
Location on edge of south polar cap

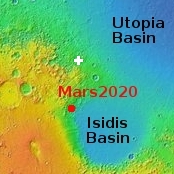
It is not known yet the size of this meteorite. The location is shown in the overview image to the right, with the impact indicated by the white dot. The black circle in the middle of the image is the south pole itself, an area where MRO’s orbit does not allow imagery. This location, on the edge of the Martian polar cap, is helpful to scientists because it has excavated material from below the cap, providing them a peek into previously unseen the geology there. Had the impact been farther south, on the thicker cap, that hidden material below the cap would likely not have been exposed.

The cap itself is made up of both ice and frozen carbon dioxide, though the CO2 is mostly seen as frost during winter months that evaporates during the summer.

Planetary rover update: January 22, 2019

Summary: Curiosity begins journey off of Vera Rubin Ridge. Opportunity’s silence is now more than seven months long, with new dust storms arriving. Yutu-2 begins roving the Moon’s far side.

Before providing today’s update, I have decided to provide links to all the updates that have taken place since I provided a full list in my February 8, 2018 update. As I noted then, this allows my new readers to catch up and have a better understanding of where each rover is, where each is heading, and what fascinating things they have seen in the past few years.

These updates began when I decided to figure out the overall context of Curiosity’s travels, which resulted in my March 2016 post, Pinpointing Curiosity’s location in Gale Crater. Then, when Curiosity started to travel through the fascinating and rough Murray Buttes terrain in the summer of 2016, I stated to post regular updates. To understand the press releases from NASA on the rover’s discoveries it is really necessary to understand the larger picture, which is what these updates provide. Soon, I added Opportunity to the updates, with the larger context of its recent travels along the rim of Endeavour Crater explained in my May 15, 2017 rover update.

Now an update of what has happened since November!
» Read more

No Planet X needed

The uncertainty of science: New computer models now suggest that the orbits of the known Kuiper Belt objects can be explained without the need for the theorized large Planet X.

The weirdly clustered orbits of some far-flung bodies in our solar system can be explained without invoking a big, undiscovered “Planet Nine,” a new study suggests.

The shepherding gravitational pull could come from many fellow trans-Neptunian objects (TNOs) rather than a single massive world, according to the research.

“If you remove Planet Nine from the model, and instead allow for lots of small objects scattered across a wide area, collective attractions between those objects could just as easily account for the eccentric orbits we see in some TNOs,” study lead author Antranik Sefilian, a doctoral student in the Department of Applied Mathematics and Theoretical Physics at Cambridge University in England, said in a statement.

When you think about it, having many many scattered small objects in the Kuiper Belt makes much more sense than a few giant planets. Out there, it would be difficult for large objects to coalesce from the solar system’s initial accretion disk. The density of material would be too low. However, you might get a lot of small objects from that disk, which once formed would be too far apart to accrete into larger planets.

The use of the term “Planet Nine” by these scientists however is somewhat annoying, and that has less to do with Pluto and more to do with the general understanding of what it means to be a planet that has been evolving in the past two decades. There are clearly more than eight planets known in the solar system now. The large moons of the gas giants as well as the larger dwarf planets, such as Ceres, have been shown to have all the complex features of planets. And fundamentally, they are large enough to be spheres, not misshaped asteroids.

Is the pole of the Milky Way’s central black hole pointing directly at us?

The uncertainty of science: New data obtained using a constellation of Earth-based telescopes, working as a unit, strongly suggests that the pole of the Milky Way7s supermassive central black hole, dubbed Sagittarius A* (pronounced A-star), is pointing directly at us.

The high quality of the unscattered image has allowed the team to constrain theoretical models for the gas around Sgr A*. The bulk of the radio emission is coming from a mere 300 milllionth of a degree, and the source has a symmetrical morphology. “This may indicate that the radio emission is produced in a disk of infalling gas rather than by a radio jet,” explains Sara Issaoun, graduate student at the Radboud University Nijmegen in the Netherlands, who leads the work and has tested several computer models against the data. “However, that would make Sgr A* an exception compared to other radio emitting black holes. The alternative could be that the radio jet is pointing almost at us”.

The German astronomer Heino Falcke, Professor of Radio Astronomy at Radboud University and PhD supervisor of Issaoun, calls this statement very unusual, but he also no longer rules it out. Last year, Falcke would have considered this a contrived model, but recently the GRAVITY team came to a similar conclusion using ESO’s Very Large Telescope Interferometer of optical telescopes and an independent technique. “Maybe this is true after all”, concludes Falcke, “and we are looking at this beast from a very special vantage point.”

If this is true, it might explain why Sgr A* is generally observed to be one of the quietest central supermassive black holes known. Compared to many others, its flux of emissions is far less.

Democratic House threatens Webb cancellation

The House, now controlled by the Democratic Party, has threatened cancellation of the James Webb Space Telescope should that project, already overbudget by $8 billion and 9 years behind schedule, fail to meet its present budget limits.

[The House budget] bill includes the full $304.6 million requested for JWST in 2019, but the report accompanying the bill offered harsh language, and a warning, regarding the space telescope given the cost overruns and schedule delays announced last year.

“There is profound disappointment with both NASA and its contractors regarding mismanagement, complete lack of careful oversight, and overall poor basic workmanship on JWST,” the report states. “NASA and its commercial partners seem to believe that congressional funding for this project and other development efforts is an entitlement, unaffected by failures to stay on schedule or within budget.”

The bill does increase the cost cap for JWST by about $800 million, to a little more than $8.8 billion, to address the latest overruns. “NASA should strictly adhere to this cap or, under this agreement, JWST will have to find cost savings or cancel the mission,” the report states.

I really don’t take this Congressional threat seriously. Our Congress is universally known in Washington as an easy mark for big money. The technique is called a buy-in, where you initially lowball the budget of your project, get it started, and then when it goes overbudget, Congress routinely shovels out the money to continue. Webb is a classic and maybe the worst example of this, but this game has been going on since the 1960s, with no sense that the Congresses of the last half century have had any problem with it.

And I especially don’t take it seriously from the Democrats who, even more than the Republicans, like to shovel money out.

The bankrupt unwillingness of both parties to care for the interest of the country for the past few decades in this matter explains why we have federal debt exceeding $20 trillion.

Scientists calculate length of Saturn’s day

Using Cassini data of the rotation rate of Saturn’s rings, scientists have calculated what they think is the precise rotation rate of the planet itself.

Using new data from NASA’s Cassini spacecraft, researchers believe they have solved a longstanding mystery of solar system science: the length of a day on Saturn. It’s 10 hours, 33 minutes and 38 seconds. The figure has eluded planetary scientists for decades, because the gas giant has no solid surface with landmarks to track as it rotates, and it has an unusual magnetic field that hides the planet’s rotation rate.

The answer, it turned out, was hidden in the rings. During Cassini’s orbits of Saturn, instruments examined the icy, rocky rings in unprecedented detail. Christopher Mankovich, a graduate student in astronomy and astrophysics at UC Santa Cruz, used the data to study wave patterns within the rings. His work determined that the rings respond to vibrations within the planet itself, acting similarly to the seismometers used to measure movement caused by earthquakes. The interior of Saturn vibrates at frequencies that cause variations in its gravitational field. The rings, in turn, detect those movements in the field.

…Mankovich’s research, published Jan. 17 by Astrophysical Journal, describes how he developed models of Saturn’s internal structure that would match the rings’ waves. That allowed him to track the movements of the interior of the planet – and thus, its rotation. [emphasis mine]

This work certainly seems ingenious, clever, and somewhat convincing, but I must admit I laughed when I read their estimate of the day length above, to the second. That is ridiculous. Their margin of error cannot possibly be that small. Mankovich has for sure narrowed the uncertainty in the length of Saturn’s day, but forgive me if I remain skeptical as to the precision claimed.

Volcanic vent between Arsia and Pavonis Monsa

volcanic vent on Mars

Cool image time. The photo on the right, rotated, cropped, and reduced to post here, was taken in September by the high resolution camera of Mars Reconnaissance Orbiter (MRO) and was part of the November image release. Click on the image to see the entire photograph at full resolution.

The uncaptioned release dubs this feature as “Small Eruptive Vents South of Pavonis Mons.” In truth, these vent pits are located almost exactly the same distance from both Pavonis Mons, the middle volcano in the line of three giant Martian volcanoes, and Arsia Mons, the southernmost of the three.

The image is interesting for several reasons. First, note the bulge surrounding the vent, making this look almost like a miniature volcano all its own. In fact, that is probably what it is. When it was active that bulge was likely caused by that activity, though it is hard to say whether the bulge was caused by flow coming from out of the vent, or by pressure from below pushing upward to cause the ground to rise. It could even have been a combination of both.

To my eye, most of the bulge was probably caused from pressure from below pushing upward. The edge of the bulge does not look like the leading edge of a lava flow. Still, this probably happened so long ago that Martian wind erosion and dust could have obscured that leading edge.

That this is old is indicated by the dunelike ripples inside the large pit, and the pond of trapped dust in the smaller pit. Because of the thinness of the Martian atmosphere it takes time to gather that much dust, during which time no eruptions have occurred.

One more interesting detail: If you look at the pits in full resolution, you will see that, based on the asymmetrical wind patterns between the west and east rims, the prevailing winds here are from the west. Located as it is just to the east of the gigantic saddle between Arsia and Pavonis Mons, this wind orientation makes sense, as a saddle between mountains tends to concentrate the wind, much like a narrowed section in a river produces faster water flow and rapids. As for why the wind blows mostly from the west, my guess (which should not be taken very seriously) is that it is probably caused by the same meteorological phenomenon that causes this generally on Earth, the planet’s rotation.

Summer has finally arrived on Titan’s northern hemisphere

The uncertainty of science: In a review of Cassini data from 2016, scientists have finally identified rain in the northern polar regions of Titan, signaling the onset of summer there.

The whole Titan community has been looking forward to seeing clouds and rains on Titan’s north pole, indicating the start of the northern summer, but despite what the climate models had predicted, we weren’t even seeing any clouds,” said Rajani Dhingra, a doctoral student in physics at the University of Idaho in Moscow, and lead author of the new study accepted for publication in Geophysical Research Letters, a journal of the American Geophysical Union. “People called it the curious case of missing clouds.”

Dhingra and her colleagues identified a reflective feature near Titan’s north pole on an image taken June 7, 2016, by Cassini’s near-infrared instrument, the Visual and Infrared Mapping Spectrometer. The reflective feature covered approximately 46,332 square miles, roughly half the size of the Great Lakes, and did not appear on images from previous and subsequent Cassini passes.

Analyses of the short-term reflective feature suggested it likely resulted from sunlight reflecting off a wet surface. The study attributes the reflection to a methane rainfall event, followed by a probable period of evaporation. “It’s like looking at a sunlit wet sidewalk,” Dhingra said.

Though the data somewhat matches their climate models, those models did not predict the rain’s late arrival, which means they need revision. I guarantee that this will not be the last revision, though without an orbiter at Saturn it will probably be decades before we have new data to make that possible.

Update on Chang’e-4 plant experiments

Link here. It appears the plant experiment has now run its course, designed as it was to end before the arrival of the first lunar night.

The experiment’s chief designer, Xie Gengxin of Chongqing University, told Xinhua that life inside the canister would not survive the lander’s first lunar night, which started on Sunday. The moon’s nighttime period lasts for about two Earth weeks.

It also appears that though the plant experiment included potato, cotton, and oilseed rape, only the cotton seeds spouted. China has only released a limited amount of information about this research, so to get further details we will likely have to wait for the published papers.

Seeds sprout on Chang’e-4

The new colonial movement: The cotten seeds in a plant experiment on Chang’e-4 have now sprouted, becoming the first biological life to grow on the Moon.

On Tuesday, Chinese state media said the cotton seeds had now grown buds. The ruling Communist Party’s official mouthpiece the People’s Daily tweeted an image of the sprouted seed, saying it marked “the completion of humankind’s first biological experiment on the Moon”.

Fred Watson, Australian Astronomical Observatory’s astronomer-at-large, told the BBC the development was “good news”. “It suggests that there might not be insurmountable problems for astronauts in future trying to grow their own crops on the moon in a controlled environment. …I think there’s certainly a great deal of interest in using the Moon as staging post, particularly for flights to Mars, because it’s relatively near the Earth,” Mr Watson said.

Prof Xie Gengxin, the experiment’s chief designer, was quoted as saying in the South China Morning Post: “We have given consideration to future survival in space. Learning about these plants’ growth in a low-gravity environment would allow us to lay the foundation for our future establishment of space base.” He said cotton could eventually be used for clothing while the potatoes could be a food source for astronauts and the rapeseed for oil.

This experiment is actually a very big deal, as it is the first biological experiment, ever, to take place in a low gravity environment. All previous plant experiments in space have taken place in zero gravity, and thus failed to tell us anything about growth in a partial Earth gravity environment.

That the seeds have sprouted only tells us that they can. What we don’t know yet is if the low lunar gravity distorts their growth.

Weird erosion in large Martian craters

Central pit in Asimov Crater

Cool image time! In reviewing the images in the December image release from the high resolution camera on Mars Reconnaissance Orbiter (MRO, I came across the image to the right, cropped, rotated and reduced to post here, showing the western half of the central pit of Asimov Crater. (Click on the link for the entire photograph.) The eastern half can be seen here.

It is unusual to see central pits in craters. One instead expects to see central peaks. The pit itself is intriguing because of its sinkhole appearance. In both the northwest and southwest corners you can clearly see drainages flowing down into the pit, including recent faint darkened streaks indicative of past seep avalanches. The same can been seen for the pit’s eastern half. Along the pit’s western rim are parallel cracks suggesting that the plateau itself is slowly shifting downward into the pit.

Furthermore, the rim cliff has multiple drainage gullies, all beginning just below the initial top layers. The look of those cliffs is very similar to what sees on the walls of the Grand Canyon, where the top of the cliffs show layers with the bottom of the cliffs buried under a slope of alluvial fill, material that has fallen to slowly form those slopes. The drainage gullies however would have come later, and suggest that some form of seepage is coming out of the contact between the layers at the top of the slope.

A look at the context image below and to the right reveals the greater mystery of this crater, as well as nearby Maunder Crater, the subject of a recent captioned image release from Mars Odyssey.

context map showing Asimov and Maunder Craters

In both cases a circular interior gully separates the crater floor from the crater’s rim. In fact, the crater floor almost appears raised. This is especially striking with Asimov Crater, where the central floor appears like a very flat plateau, except for that central pit and the surrounding gully.

The MRO team has taken a lot of images of the gullies, which you can see if you zoom in to latitude -46.843° longitude 4.831° on the map image at this website. It is clear that they want to know more about the origins of this geology. It suggests water flow, even though these craters are located in the Martian southern highlands, a place that is more reminiscent of the Moon, with many ancient craters and far less evidence of significant change.

What the geology in these two craters suggest is that some erosion process is eating away at the crater floors, beginning at its edges as well where there are voids below that allow the surface to sink. While that erosion is certainly helped by wind, it also implies the presence of underground water, either as ice or liquid, in the past and even possibly today.

Ceres’ bright spots in Occator Crater

Occator Crater bright spot

Cool image time! The Dawn science team has released some additional images taken shortly before the mission’s conclusion when Dawn was in its closest orbit of the dwarf planet Ceres. On the right is a tiny cropped portion of a much larger mosaic of the bright spots on the floor of Occator Crater, focusing on one large bright spot that also includes a fissure cutting across it. If you click on the image you can see the entire mosaic, covering an additional four more bright areas.

The mosaic was taken in June 2018 from a distance of 21 miles.

The press release describes these bright areas as “deposits of salts, in particular sodium carbonate, possibly extruded through fractures connecting the surface to a deep reservoir of salty liquid.” That surely looks confirmed by the fissures in the image to the right.

Chandrayaan-2 launch now scheduled for mid-April

The new colonial movement: India’s Chandrayaan-2 lander/rover mission to the south pole region of the Moon has now been re-scheduled for mid-April.

The launch date had to be pushed from the initially scheduled January-February window, as a few related tests could not be completed by the Indian Space Research Organisation (Isro). Isro chairman K Sivan told the media on Friday that the next available slot is during March-April, and the launch could take place by mid-April. However, if this window is passed, the prestigious mission will have to be pushed again to June.

The article also suggests that they have made some changes to the mission’s flight plan.

Earth’s magnetic field undergoing unexpected changes

The uncertainty of science: For reasons that scientists do not understand, the Earth’s magnetic field has been undergoing unexpected shifts in the past two years, causing its north pole to move significantly and somewhat quickly from Canada across to Siberia.

Earth’s north magnetic pole has been skittering away from Canada and towards Siberia, driven by liquid iron sloshing within the planet’s core. The magnetic pole is moving so quickly that it has forced the world’s geomagnetism experts into a rare move.

On 15 January, they are set to update the World Magnetic Model, which describes the planet’s magnetic field and underlies all modern navigation, from the systems that steer ships at sea to Google Maps on smartphones.

The most recent version of the model came out in 2015 and was supposed to last until 2020 — but the magnetic field is changing so rapidly that researchers have to fix the model now. “The error is increasing all the time,” says Arnaud Chulliat, a geomagnetist at the University of Colorado Boulder and the National Oceanic and Atmospheric Administration’s (NOAA’s) National Centers for Environmental Information.

Note that they have delayed the release of the World Magnetic Model until January 30, claiming the delay is caused by the government shutdown. Seems bogus to me. As I have already noted, these scientists aren’t slaves. If they think this is so important, and they have completed their work (which the article suggests they have), they can release the model, regardless of the federal government’s funding.

Hat tip reader Stephen Taylor.

Lopsided ejecta from Martian crater

Crater with unequal ejecta

Cool image time! The image on the right, reduced and cropped to post here, comes from the December image release from the high resolution camera of Mars Reconnaissance Orbiter (MRO). (If you click on the image you can see the full resolution uncropped photograph.) Released without a caption, the release itself is intriguingly entitled, “Crater with Preferential Ejecta Distribution on Possible Glacial Unit.

The uneven distribution of ejecta material around the crater is obvious. For some reason, the ground was preferentially disturbed to the north by the impact. Moreover, the entire crater and its surrounding terrain look like the impact occurred in a place that was saturated somewhat with liquid, making the ground soft like mud.

That there might have been liquid or damp material here when this impact occurred is reinforced by the fact that this crater is located in the middle of Amazonis Planitia, one of the larger regions of Mars’ vast northern lowland plains, where there is evidence of the past existence of an intermittent ocean.

This however really does not answer the question of why most of the impact’s ejecta fell to the north of the crater. From the release title is appears the planetary geologists think that this uneven distribution occurred because the impact occurred on a glacier. As the ground has a lighter appearance just to the south of the crater, I suspect their reasoning is that this light ground was hard bedrock while the darker material to the north was that glacial unit where the ground was more easily disturbed.

This is a guess however (a common requirement by anyone trying to explain the strange features so often found on the Martian surface). Other theories are welcome of course, and could easily be correct as well.

Shutdown and government politics slows some science work

The partial government shutdown appears to be causing problems for some researchers, some of it fake and some of it real.

The article doesn’t put it that way. Instead, it sells the shutdown as a terrible tragedy, blocking all work by scientists, a claim that simply isn’t true if you read the article honestly.

The real problems include cases where the closure of government buildings prevents scientists from accessing their labs or research samples. The fake problems include things like this:

Rattlesnakes, bears, hurricanes, and freezing weather haven’t stopped ecologist Jeff Atkins from taking weekly hikes into Virginia’s Shenandoah National Park for the past 8 years to collect water samples from remote streams. But Atkins is now facing an insurmountable obstacle: the partial shutdown of the U.S. government, in its third week.

Park managers have barred Atkins from entering since 22 December 2018, when Congress and President Donald Trump failed to agree on a deal to fund about one-quarter of the federal government, including the National Park Service. That has shut down the sampling, part of a 40-year-old effort to monitor how the streams are recovering from the acid rain that poisoned them in past decades.

There is no reason this scientist can’t enter the park and get his samples. In fact, Trump administration policy has kept the national parks open, even if no one is working there. I am thus very suspicious of the claim that he is “barred” from entering.

Then there are claims that government scientists are forbidden from attending conferences. Bah. They aren’t slaves. If the conference is that important, they should go on their own dime. And if they aren’t willing to go, it makes me suspect their work is not that important. In fact, I know this, as I have watched many government scientists attend conferences merely to tout the wonderful things their government agency is accomplishing, not to really report on science.

The article also makes a big deal about the loss of pay to these individual scientists. My heart bleeds. For one thing, as government workers they are generally paid at a far higher rate, with many more benefits, than most taxpayers, who for the past decade have been suffering far worst economic times. These government scientists can afford the loss of pay for a few weeks.

For another, based on what has happened after all other previous shutdowns, Congress will approve their pay during this time, meaning this shutdown is really nothing more than an extra paid vacation for them.

I thus find myself having little sympathy for these scientists. In fact, the facts in this article make me inclined to think the taxpayer might benefit from getting rid of them all.

TESS spots first exoplanets plus supernovae and more

The Transiting Exoplanet Surveying Satellite (TESS) has successful spotted its first exoplanets.

NASA’s Transiting Exoplanet Survey Satellite (TESS) has found three confirmed exoplanets, or worlds beyond our solar system, in its first three months of observations.

The mission’s sensitive cameras also captured 100 short-lived changes — most of them likely stellar outbursts — in the same region of the sky. They include six supernova explosions whose brightening light was recorded by TESS even before the outbursts were discovered by ground-based telescopes.

These discoveries confirm that the spacecraft is operating exactly as designed. Now comes the herculean task of analyzing the gigantic amount of data it is pouring down to see what is hidden there.

Flowing cracked mud on Mars?

mud cracks in crater?

Cool image time! The image on the right, rotated, cropped, and reduced to post here, comes from the December image release of the high resolution camera of Mars Reconnaissance Orbiter (MRO. Uncaptioned, the release titles this image “Cracks in Crater Deposit in Acheron Fossae.” If you click on the image you can see the entire photograph at full resolution.

Clearly the cracks appear to be caused by a downward slumping to the north, almost like a glacier made of mud. We can also see places on the image’s right edge where the mud appears to have flowed off a north-south trending ridge, then flowed downhill to the north. All of this flow is away from the crater’s central peak, which is only partly seen in the photograph near the bottom. That section is the central peak’s southwestern end, with the whole peak a ridge curving to the northeast beyond the edge of the image.

At the north edge of this mud flow the cracks become wider canyons, as if long term erosion is slowing washing the mud away. The flow then stair steps downward in a series of parallel benches. Meanwhile, in the flat central area of the mud flow above can be seen oblong depressions suggesting sinks that also flow to the north.

crater context overview

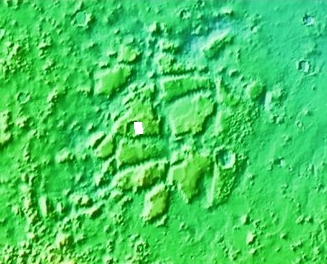
You can get a better idea of the crater’s overall floor and central peak by the low resolution context image to the right. The white rectangular box indicates the area covered by the full image above. A close look at this part of the crater floor suggests to me a circular feature like a faint eroded smaller crater that includes as its eastern rim the larger crater’s central peak. This impression suggests that the flows seen in the full resolution image are heading downhill into the lowest point of this smaller crater, that upon impact had reshaped the larger crater’s floor.

This impression however is far from conclusive. The features in the large crater could simply be the random geology that often occurs in the floors of impact craters.

What makes this particular mud slide most interesting, as is usually the case for most Martian terrain, is its location.
» Read more

Sunspot update December 2018: Decline to solar minimum continues

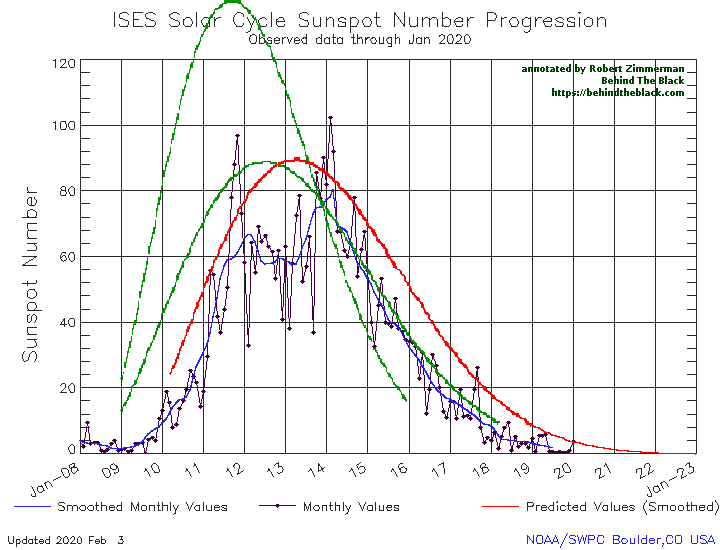
Time for the monthly solar cycle update! NOAA today posted its monthly update of the solar cycle, covering sunspot activity for December 2018. As I do every month, I am posting it below, annotated to give it some context.

December 2018 sunspot activity

The graph above has been modified to show the predictions of the solar science community. The green curves show the community’s two original predictions from April 2007, with half the scientists predicting a very strong maximum and half predicting a weak one. The red curve is their revised May 2009 prediction.

There really isn’t much to say about the sunspot activity in December. It continued to show a steady decline to solar minimum, exhibiting activity very comparable to what we saw in mid-2008 when the previous unusually long and extended solar minimum began.

One interested detail however: When NOAA issued this graph last month, it finally extended it out beyond the end of 2019 to the end of 2022. In doing so, it also extended out the 2009 prediction of the solar science community, as indicated by the red curve. I hadn’t commented on this last month, but if you look at that curve it drops to zero and then flatlines for the entire year of 2022.

If this is what the solar science community now expects for this upcoming minimum, it means that community is now expecting a record-breaking minimum, lasting far longer than any previous minimum, two to three years at least. It also means that they have not dismissed the possibility that the Sun is about to enter a Grand Minimum, where no significant sunspot activity is seen for literally decades.

Should such a grand minimum occur, it bodes ill for global warming advocates. The track record of the Earth’s climate consistently shows that when sunspot activity declines, the global climate gets colder. Why this happens is not clearly understood, though there is at least one theory backed up by good experimental data. Should this happen, we shall discover that global cooling is a far worse thing to fear than global warming.

Using LRO to find Chang’e-4

LRO image of Chang'e-4 landing area

The Lunar Reconnaissance Orbiter (LRO) science team has released a high resolution image from 2010 pinpointing the area on the floor of Von Kármán crater where Chang’e-4 landed. On the right is a reduced and partly annotated version.

They have not actually found the lander/rover, since this image was taken long ago before Chang’e-4 arrived. However, this image, combined with the Chang’e-4 landing approach image, tells us where the lander approximately landed. It also pinpoints where to look for it when LRO is next able to image this region, around the end of January.

By then, Yutu-2 will hopefully have traveled some distance from Chang’e-4, and LRO will be able to spot both on the surface.

Dust devil tracks on the Martian southern highlands

Dust devil tracks

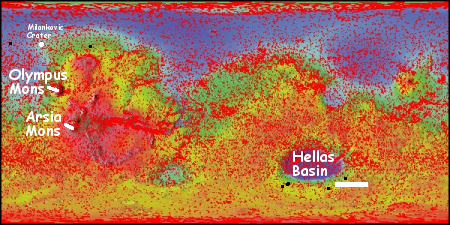
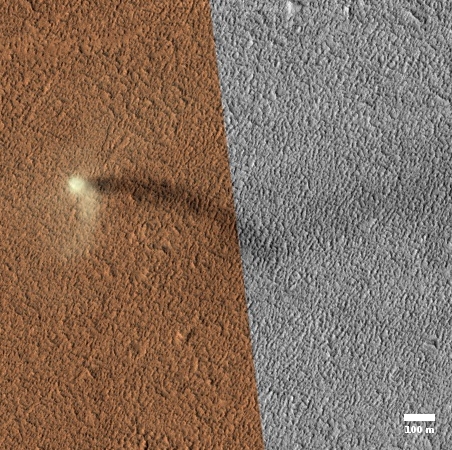
Today’s cool image is cool because of how little is there. The image to the right, cropped to post here, was part of the December image release from the high resolution camera on Mars Reconnaissance Orbiter (MRO). The uncaptioned release labeled this image simply as “Southern Intercrater Plains.” Located in the Martian southern highlands, this location is located almost due south of Arsia Mons, the southernmost in the chain of three giant volcanoes to the west of Marineris Valles (as indicated by the white dot on the overview image below).

If you click on the image you can see the entire photograph, though in this case it won’t show you much else than in the excerpt to the right. The terrain here appears flat. The only features of note are some small knobs and the random dark lines that are almost certainly accumulated dust devil tracks. There are also many dark spots, which might also be the shadows of even smaller knobs, but could also be instrument artifacts. I am not sure.

Location of dust devil image

The southern highlands are mostly cratered, with few signs that water ever flowed there. This image for example gives the impression of a vast lonely terrain that has changed little since the very earliest days of Mars’ history.

I expect that scientists could possibly assign some age to this terrain, merely by studying the dust devil tracks. If we calculate how often dust devils might traverse this place, and then count the tracks, assigning their order by faintness, with the faintest being the oldest, it could be possible to obtain a rough age of the oldest tracks.

Still, all that would do would tell us the approximate length of time in which a dust devil track can remain visible. And even if this is a long time, it doesn’t constrain the age of the surface very much, as the weather on Mars has certainly changed with time, especially because we think the atmosphere was once thicker.

What formed this flat terrain? My first guess would be a lava flow, caused when the numerous nearby craters were formed by impact. These craters were likely created during the great bombardment between 3 and 4 billion years ago, and while they have certainly been modified more than lunar craters because of the presence of an atmosphere on Mars, they are likely to have not changed much during that time. Similarly, this flat terrain is likely much like it was, several billion years ago. Dust devils have deposited dust and their tracks, but the hard bedrock remains as it was soon after it solidified.

1 111 112 113 114 115 271