Webb to release first science images July 12th
The science team for the James Webb Space Telescope announced today that the first infrared science images from the telescope will be released on July 12, 2022.
The first images package of materials will highlight the science themes that inspired the mission and will be the focus of its work: the early universe, the evolution of galaxies through time, the lifecycle of stars, and other worlds. All of Webb’s commissioning data – the data taken while aligning the telescope and preparing the instruments – will also be made publicly available.
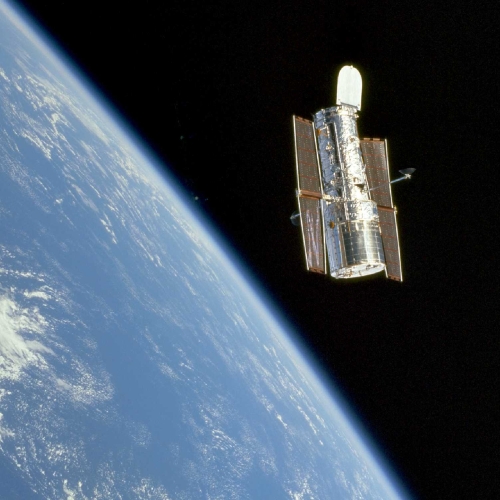
In many ways this first release will likely mirror the first release of images from the Hubble Space Telescope in 1993, after its serious focus problem had been solved. Then, the science team and NASA picked images for the press conference that, to them, would pass what they called the “grandmother test,” whereby an ordinary person not familiar with space objects would still instantly recognize the object imaged.
The result of that criteria was that some of Hubble’s best ground-breaking first images were not included, such as its first sharp picture of the exploding star Eta Carinae. While the images shown were beautiful, they did not immediately demonstrate what Hubble was going to accomplish. The Eta Carinae picture did however.
Hopefully this time the scientists will be more daring, and have a greater respect for the general public, and include some infrared images that are not familiar to non-scientists. It is such data that is almost always the most exciting.