
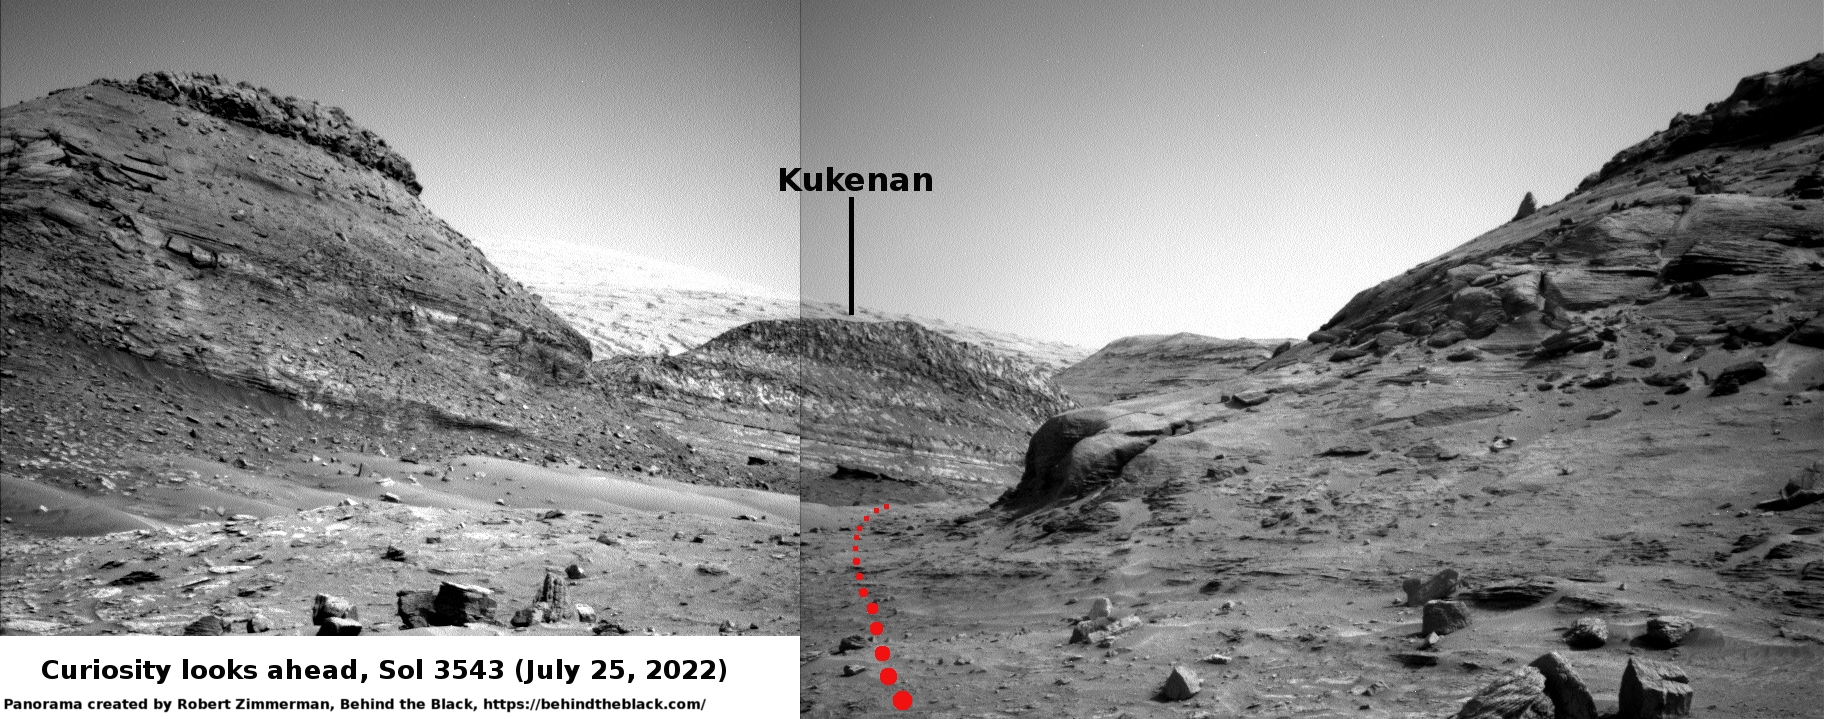
Curiosity looks ahead
Click for full resolution. For original images go here and here.
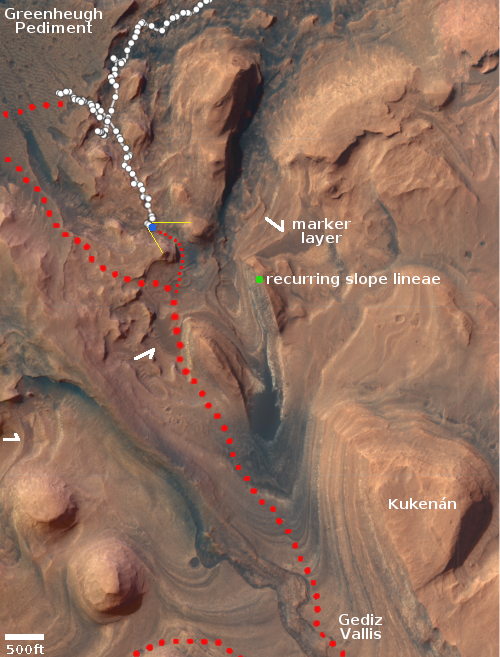
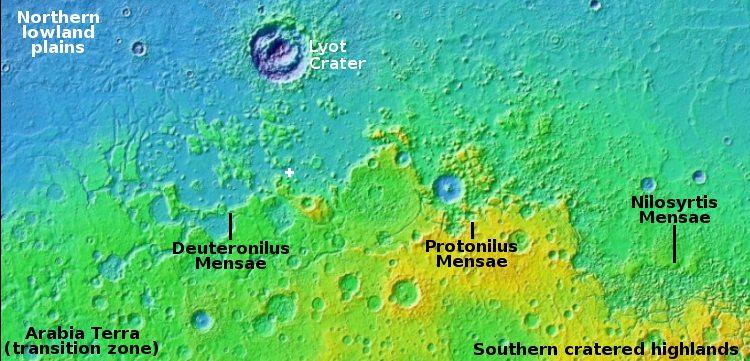
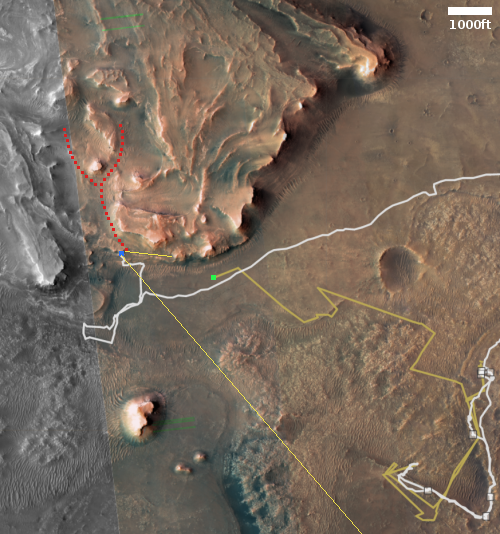
Click for interactive map.
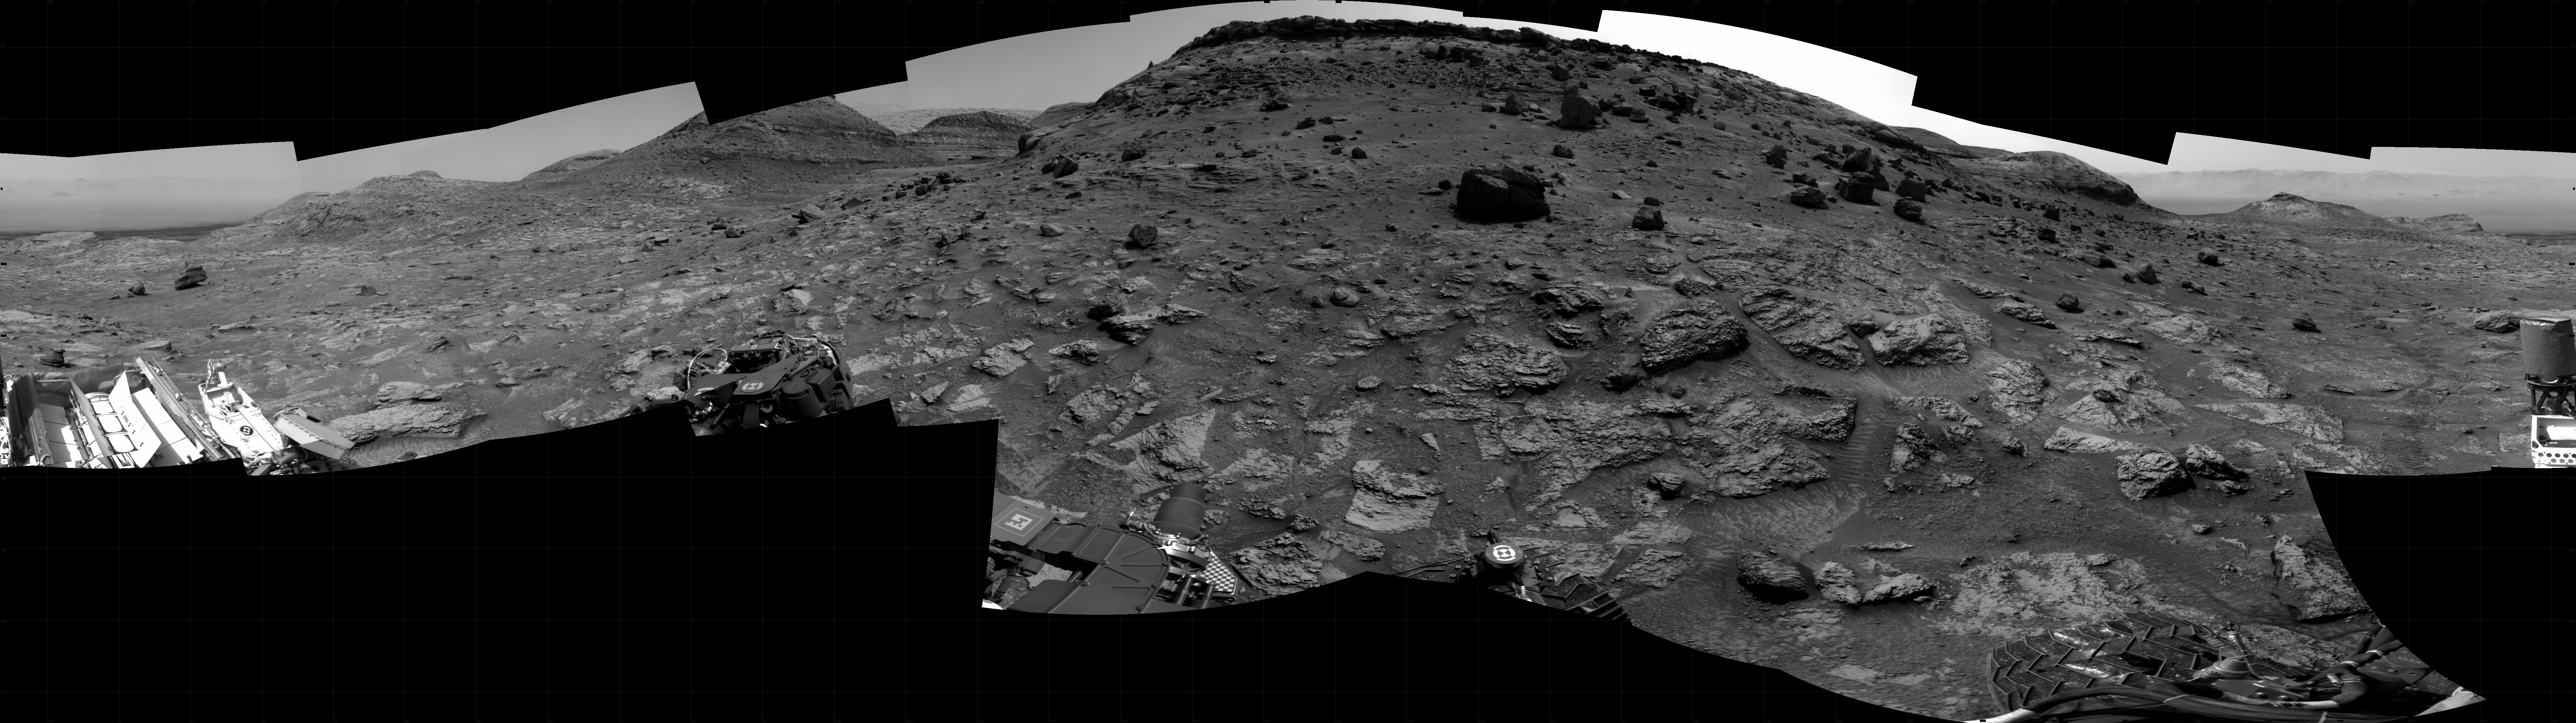
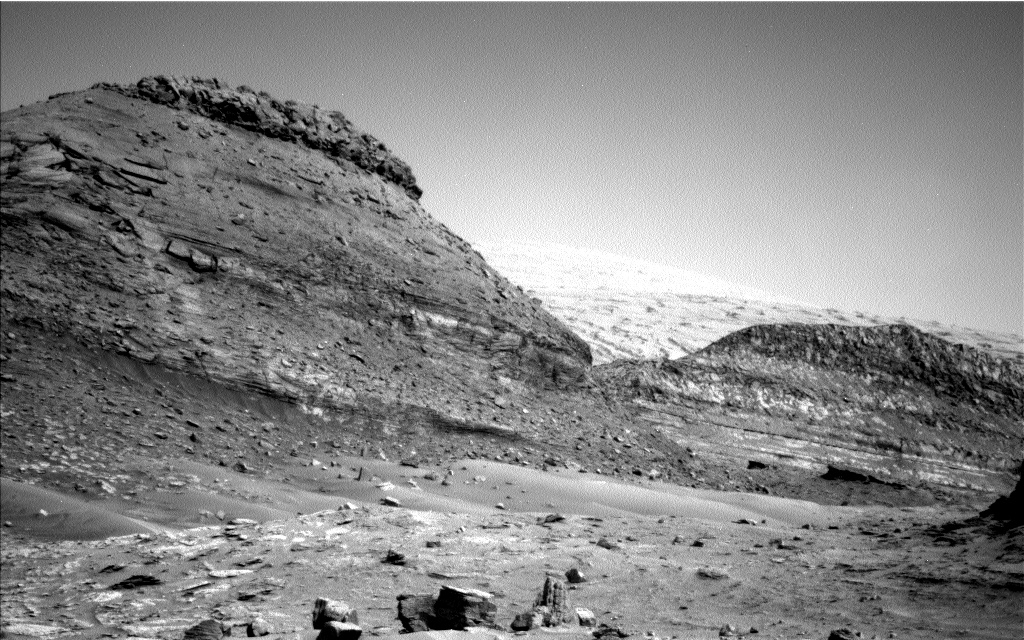
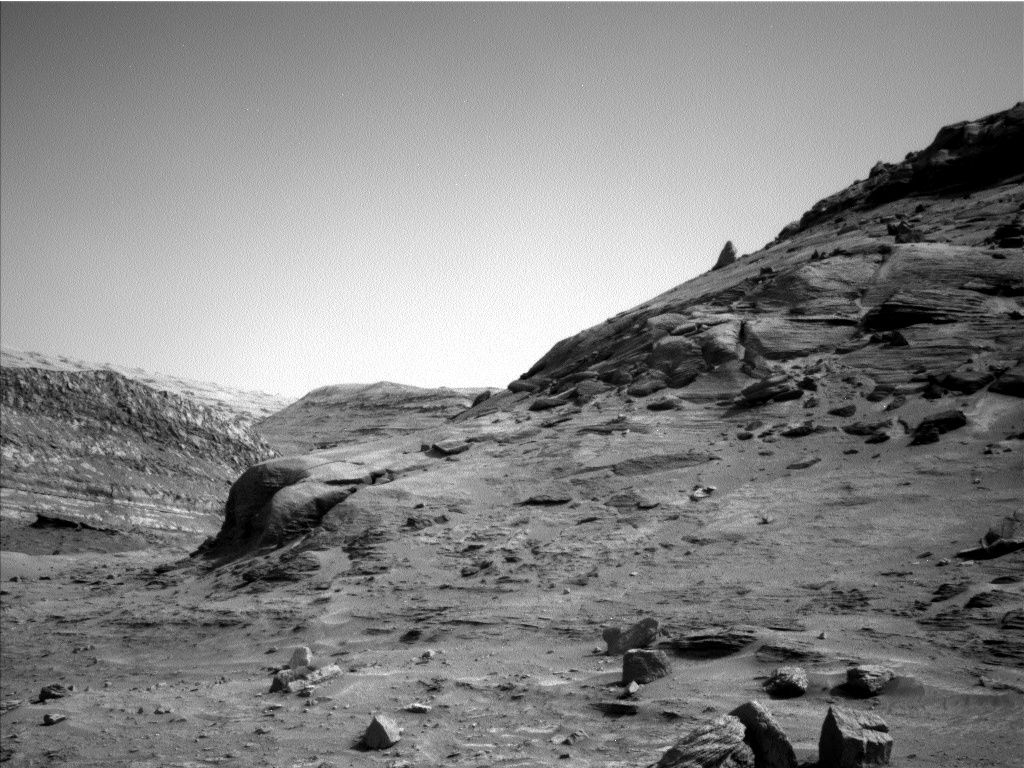
Cool image time! The panorama above, taken by one of the navigation cameras on the Mars rover Curiosity on July 23, 2022, forms a nice bookend to yesterday’s panorama. Yesterday Curiosity looked back at its past travels. Today it looks forward at where it is almost certainly heading in the days ahead.
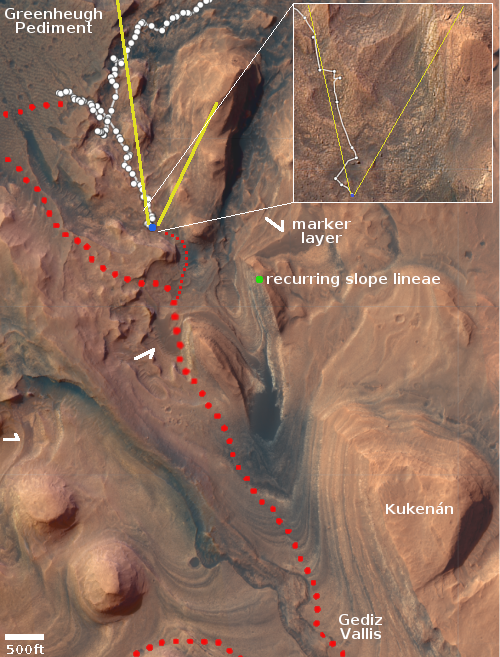
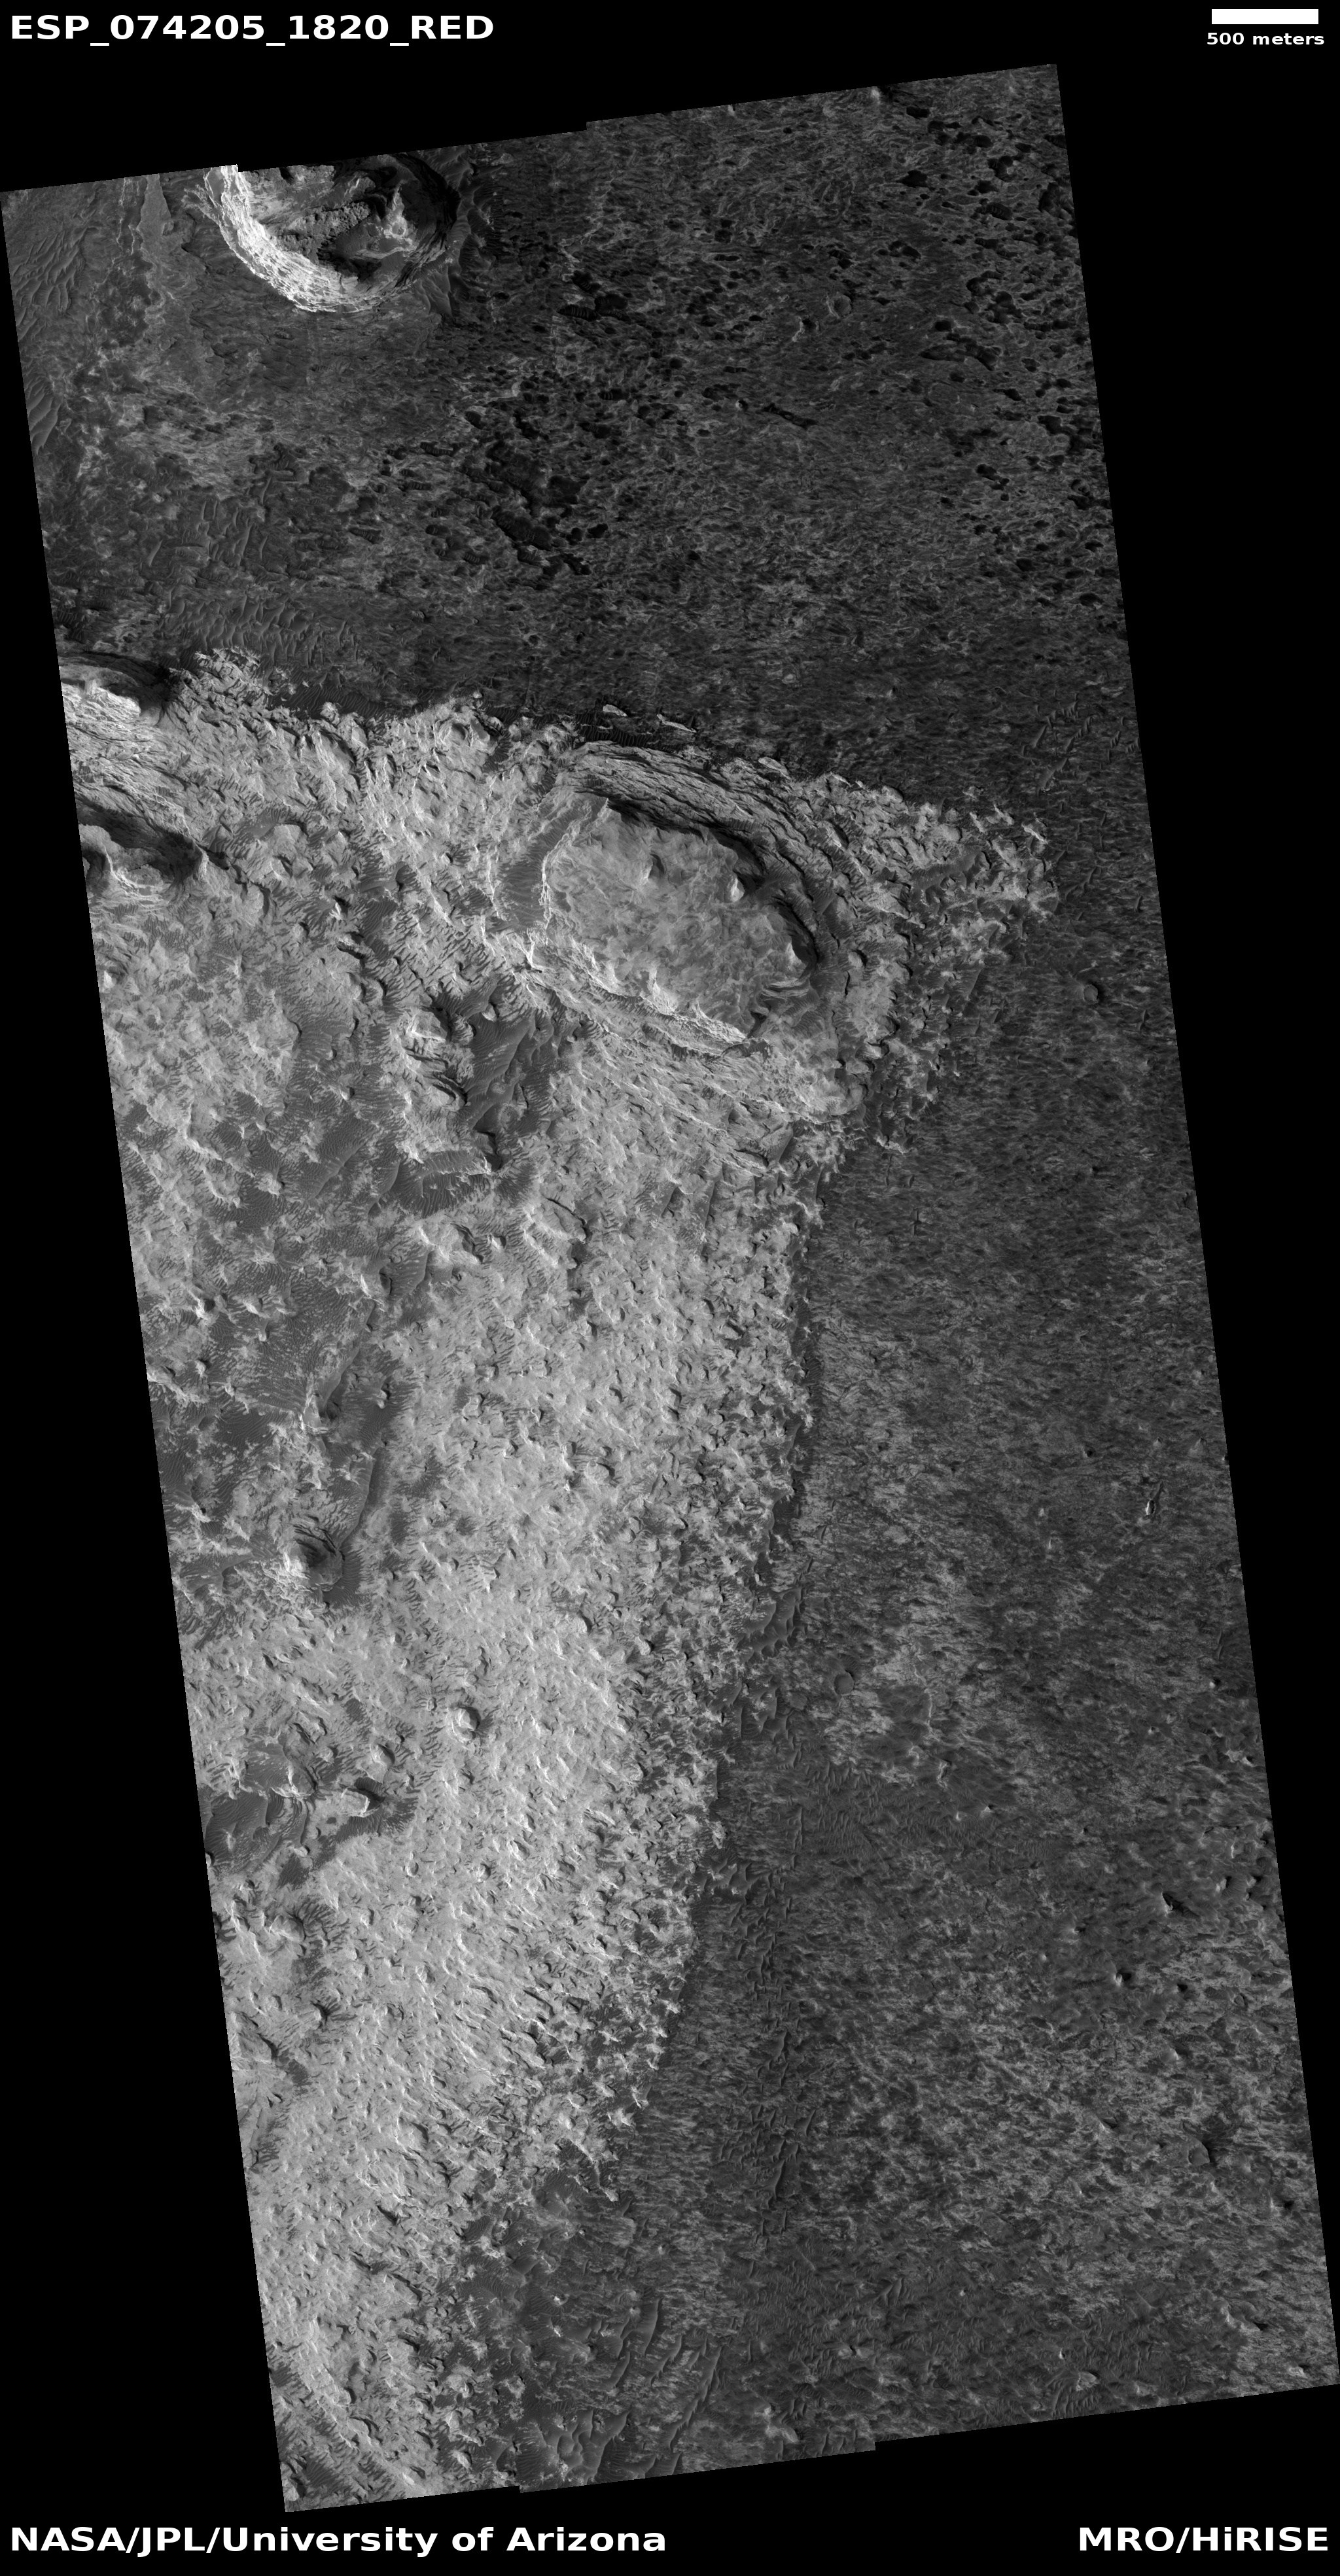
On the overview map to the right, the yellow lines indicate the approximate area viewed by the panorama. The large red dotted line marks the rover’s original planned route, abandoned when the science team found the terrain on the Greenheugh Pediment too rough for Curiosity’s wheels. The smaller red dotted line is my present guess as to the rover’s future route to get back on course.
The flat-topped mountain dubbed Kukenán by the science team has probably been one of the prime goals of the entire mission, from the beginning. Its almost vertical face has innumerable layers, all of which record in great detail the geological history of Mars and Gale Crater. As noted by Abigail Fraeman from the Jet Propulsion Laboratory on June 30, 2022:
Kukenán’s Earth namesake is a tepui, or distinctive isolated table-top mountain, found in South America. The Martian Kukenán is also somewhat flat topped and an impressive expression in Mt. Sharp’s topography. While it looks like it’s about the same size as the hills that bound it in the above Navcam image (“Deepdale” on the left and the edge of “Bolivar” on the right), this effect is just due to forced perspective. In reality, Kukenán is nearly five times farther away and over three times as tall as Deepdale! Curiosity’s strategic traverse path takes the rover right past Kukenán in about a kilometer or so, so this feature will become a familiar landmark rising in our windshield for months to come.
The science team will likely park Curiosity in the saddle of the gap ahead for at least a week and spend a lot of time documenting that cliff face with multiple cameras, since at this location the rover will have an excellent view of that entire face. As it gets closer the angle looking up will get steeper, thus making viewing of the upper layers more difficult.


