Sunspot update: A tiny burst of activity that might mean something
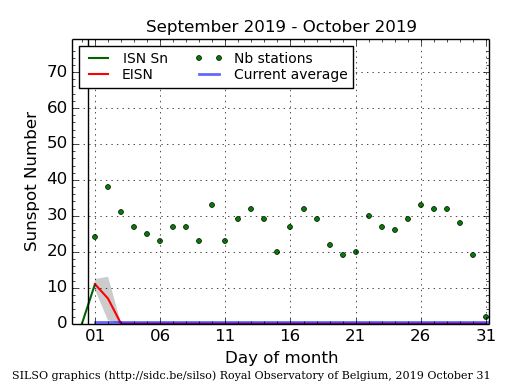
On February 3, 2020, NOAA posted its January of its monthly graph showing the long term sunspot activity of the Sun. As I have done now every month since this webpage began in 2011, it is posted below, with annotations:
After seven months of practically no sunspot activity, the longest such stretch in probably a century, January had a tiny burst of activity, breaking that string. Of the month’s four sunspots, two had a polarity from the old solar cycle, two from the new.
The graph above has been modified to show the predictions of the solar science community for the previous solar maximum. The green curves show the community’s two original predictions from April 2007, with half the scientists predicting a very strong maximum and half predicting a weak one. The red curve is their revised May 2009 prediction, extended in November 2018 four years into the future.
Despite their low number and general weakness, the continuing appearance of sunspots with polarities aligned with the new cycle strongly indicates that we will have a solar maximum in the next five years, not a grand minimum lasting decades that some scientists are predicting. While the year is young and it is certainly too soon to trust any trends, the fact that January saw an increase in activity over the past seven months suggests that we might have passed the low point of the minimum. We shall find out this year.
It must be remembered that the uncertainties in this field of science remain gigantic. No one really understands why the Sun’s magnetic dynamo goes through these cycles and flips in polarity. No one really understands why it produces sunspots as it does. And no one for sure yet knows exactly how the Sun’s cyclical behavior directly effects the climate. We only have circumstantial evidence, some of which can be legitimately questioned.
What is certain is that we don’t know very much, and are always in error when we forget this fact. Remember this always when some politician or scientist claims the science is settled or certain, and they know without doubt what is going to happen. They are either lying, fooling themselves, or are simply fools. In any case, such certainty in science should never be trusted.
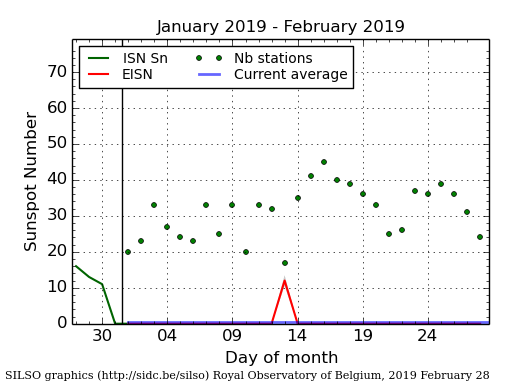